TL;DR: If you’re a brand-registered Amazon seller, you may now have access to Amazon Brand Analytics in Seller Central. There are incredible insights hidden within this data… like real customer shopping behavior, competitor insights, and even the potential to estimate total clicks and conversions per keyword! You can use these insights to start making smarter decisions and real improvements today. With our new Data Science as a Service (DSaaS) model, Viral Launch will process your Brand Analytics data, return a detailed shopper insights report, and reveal the massive golden nuggets hidden within your Brand Analytics. Please note: You must sell on Amazon.com and have access to Brand Analytics to be eligible.
One of my favorite things about data scientists is their ability to look at the world through a unique lens; a lens capable of transforming mildly interesting, yet disparate, information into incredible and profound insights. If you have ever struggled to understand the meaning of a piece of abstract art as others talk about how exquisite and meaningful the artwork is, or tried reading a restaurant menu written in a foreign language when visiting abroad, then you understand how possible it is for two people to see the exact same data, yet arrive at completely different conclusions.
Amazon’s Brand Analytics is the perfect example of data we all “know” could be valuable, yet we didn’t know exactly why it was valuable or what actions to take with this new found information.
Once our data science team got their hands on a Brand Analytics report for a client, an incredible world of mind-blowing insights began to unfold. After reading through this post, you’ll never look at your market’s keywords the same.
What is Amazon Brand Analytics?
Brand Analytics is a free report available within Seller Central for sellers in Amazon’s Brand Registry program (it is still being rolled out to all accounts).
The data provided in Brand Analytics is interesting but alone is hardly actionable and quite clunky. As a results-driven company, our brilliant data science team is obsessed with deriving results-oriented insights from all things data. They were able to turn this interesting data into game changing insights that will change the way you look at keywords, allow you to better understand your market’s customers, and ultimately, make better decisions to drive more sales and profitability for your business!
There are four incredibly valuable insights the data science team was able to pull from Brand Analytics that the average seller would normally miss. We’ll get to those in just a moment.
Important Note: We could not share any specific information in this blog post to comply with Amazon’s Brand Analytics Terms and Conditions around confidentiality. All examples align very closely to the various insights we are able to develop from customer’s Brand Analytics reports.
What’s Inside Brand Analytics?

Amazon’s Brand Analytics is available to 3P sellers that are enrolled in Amazon’s Brand Registry program. It is still being rolled out to all accounts, but if you do have access to this new report, it can be found by visiting: Brand Analytics.
Here is a breakdown of each component in the Amazon Search Terms report.
- Search Term: This is the keyword an Amazon shopper uses when looking for a product. The keyword can be an individual word such as “iphone” or a phrase such as “iphone Xs case for women”.
- Search Frequency Rank (SFR): Search Frequency Rank is reminiscent of Amazon’s Best Seller Rank (BSR) in that it calculates the popularity of one keyword relative to keywords around it. This means that the keyword with a SFR of #3 is more popular during the given timeframe than a keyword with a SFR of #5. Amazon does not provide the number of searches for a particular keyword, but the relative rank is still very helpful!
- #1 Clicked ASIN: This field is designated for the ASIN that received the most clicks from shoppers who searched this keyword. This field does not mean that the product was ranking in the first organic position.
- #1 Product Title: This is the product title of the #1 clicked ASIN.
- #1 Click Share: Amazon provides the percentage of total clicks that the #1 most clicked ASIN received. This percentage is calculated by looking at the total number of clicks after customers searched the given keyword. This does not indicate the total Click-Through Rate (CTR) of the ASIN. The Click Share is the percentage of total clicks that this ASIN saw for this keyword’s searches alone.
- If 1,000 customers searched the keyword “fish oil”, and each of those customers clicked into two products (2,000 clicks total), and Product XYZ received 500 clicks from said customers, then the click share for Product XYZ for the search term “fish oil” would be 25% (500/2000).
- #1 Conversion Share: Conversion Share is slightly different as it does not inherently represent the ASIN that received the most conversions for the given search term. It represents the percentage of total sales the #1 Clicked ASIN received for the given keyword.
- If there are a total of 1,000 sales from customers who searched “fish oil,” and the #1 most clicked ASIN saw 100 of those sales, that #1 Conversion Share would be 10%. It is possible that the most clicked ASINs do not drive the most conversions for the given search term.
- #2 & #3 Most Clicked: Amazon provides the #2 and #3 most clicked ASINs for each keyword including their Product Title, Click Share and Conversion Share.
4 Powerful Brand Analytics Insights
1. Customer Shopping Behavior: Heat Maps
Imagine having a heat map for every Amazon keyword to know exactly how customers are shopping. Imagine being able to answer questions like:
- Does the first ranking product always get the most clicks? Most sales?
- Does it vary by keyword?
- Do I have to be ranking in the top 5 to see good sales volume? Top 15?
- I’m ranking in position #7, why am I not seeing any sales?
- How much market share can I take with sponsored ads alone?
While at face value it doesn’t appear as though the Brand Analytics report provides this type of insight, our data science team was able to combine a variety of data sources to produce possibly some of the most interesting and insightful data the Amazon seller community has ever seen. We’re calling this new data Shopper Insights.
Shopper Insight Heat Maps
Here is an example Shopper Insights Map for the keyword “gifts for men”. While we can’t share exact data, this is the type of map similar to keywords like “pajamas for kids”, “easter baskets”, and “women’s dresses” in which customers must do some shopping before making a purchasing decision.

As you can see, people are shopping all the way down to the 27th ranked product. We’ve also seen Shopper Insights Maps where customers are shopping much further down.
One of the first things you’ll notice is the 9th rank position on average is seeing a higher conversion share than the second and third rank positions.
You might be asking how/why the click share and conversion share do not add up to 100%, which is completely understandable. It all comes down to the way in which we build out these heat maps. There are two contributing factors: 1) keywords do not usually maintain a single ranking position throughout the entire week. 2) We show the weighted average click and conversion share at each rank position. What this heat map does not show is the number of weeks in which we found top ranking ASINs in each position. You can find more details on how we build these heat maps down below.
The map above becomes quite a bit more interesting when you look at it next to the heat map for another keyword like “toothpicks”. While we can’t share exact data, think of the keyword “toothpicks” alongside keywords like “AA batteries”, “iPhone charging cable”, (i.e. commodity products) in which there is little decision-making or style preference involved in the buying decision.

This map is telling us that, on average, the most trafficked products are consistently ranking between the first three organic positions. The color indicates the weighted average conversion share from customers searching “toothpicks” that purchase the products found ranking at each position. You will notice a blank space between positions #3 and #5 indicating that on average products ranking in the fourth positions have not driven many clicks.
This data is extremely valuable as it tells “toothpick” sellers that the vast majority of purchases occur within the first 6 ranked products. This means that if you wish to drive sales through this keyword, ranking in the top 10 alone is not going to cut it. You have to be ranking within the first six positions. And logically, this makes sense.
Toothpicks are toothpicks. How large of a selection do shoppers really need when purchasing commodity type products?
While “toothpicks” may be an obvious example where customers require little shopping, we’ve seen plenty of examples for style-heavy products like “stroller.” At first, you may think style plays a major role in buying decisions, but this market actually has very shallow sales depth. In this example, we see that a large amount of shopping is being done in just the top four ranking positions (with the second ranking position seeing the most action on average for this group).

The old strategy was to look at the sales estimates/BSR of the products showing in the organic rankings to determine sales depth. The problem is that sales/BSR show sales driven from all keywords. This doesn’t inherently indicate how customers are shopping for a specific keyword. Shopper Insights Maps completely solve this problem. Through this Brand Analytics data, combined over time, we are able to see the sales depth for that keyword and build a ranking strategy around it.
Here are a couple other heat maps to show you drastically they can vary:
Here is a market with good sales distribution as customers are shopping well into the first page of results.

Here is a market where customer’s are shopping to only the 5th result. (notice the “Low Data” message starting at thee 6th rank position)
Here is a market where the 5th rank position’s average conversion share is greater than the first rank position. The 7th rank position has the greatest average conversion share, however, there was only 1 of 12 weeks in which we found a top three most clicked ASIN indicating much less frequency at that position.

Here is a market in which there are strong sales all the way through the 25th position, however, it’s very important to pay attention to the number of weeks a top product was found in each position. This indicates there is a lot of volatility in the ranking results.

How do we build these Shopper Insights maps?
When working with a seller, we first compile their Brand Analytics reports from the past 90 days. Then, we look at the historical keyword rankings for the most-clicked ASINs per keyword along with the date range that those ASINs appeared.
Let’s take the week of 3/03/19 – 3/09/19 for the keyword “garlic press” (~220k searches/month) in which ASIN: XYZ was the #2 most clicked (2nd most click share). We then use our new reverse ASIN and competitor monitoring tool to identify where that ASIN was ranking during that given time period. This product spent most of the week ranking in the 1st organic ranking position, so we attribute the click share and conversion share to the #1 ranking position.

For the same week, the 3rd most clicked ASIN DEF, as you can see in the screenshot below, spent most of the week ranking between position 7 and 8 using our Competitor Intelligence tool.

And the #1 most clicked ASIN ABC spent the majority of the week ranking in the 3rd organic ranking position for the keyword “garlic press” so we have attributed their performance metrics to the third ranking position.

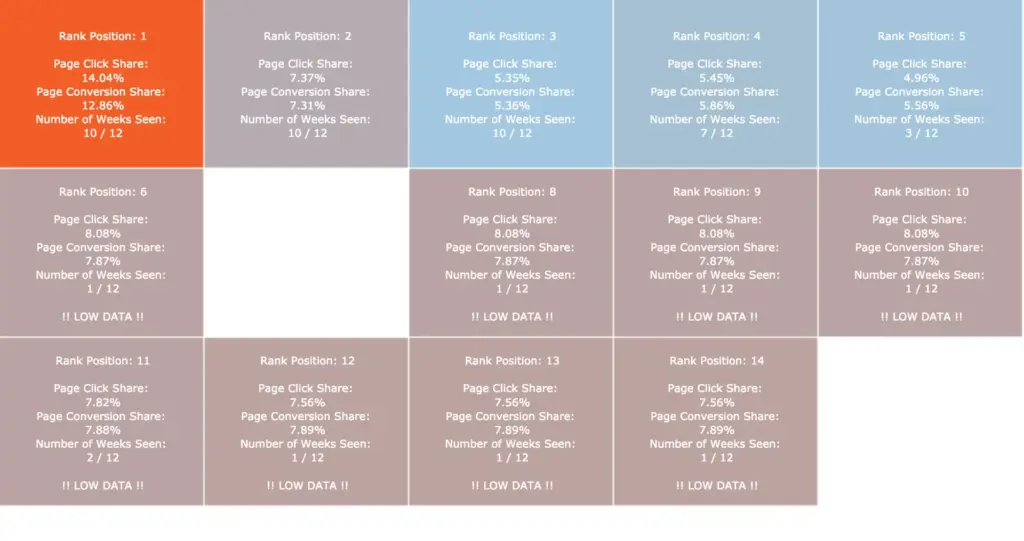
So after just one Brand Analytics weekly report, seeing just three ASINs, here is what our Shopper Insights heat map would look like.

As you can see the “Rank Position: 3” box is the darkest with the highest conversion share which was derived from the stats of the #1 most clicked ASIN in the week.
The “Rank Position: 1” box has the second highest conversion share and represents the stats of the #2 most clicked ASIN.
Representing the #3 most clicked ASIN, there are two boxes filled in “Rank Position: 7” and “Rank Position: 8”. Both boxes are filled in because the product spent a good portion of the week ranking in the #7 position as well as the #8 position.
Now, imagine building this report 11 more times for each of the 12 prior weeks of Brand Analytics reports for the keyword “garlic press”. The top clicked ASINs may change over time, and where the most clicked ASINs ranked in the search results will likely also change. The data science team layers on these 12 reports on a keyword basis to develop the final “heat map”
It’s important to note that the given depth is not total depth. Depth is key, and it is based on the most clicked products for each keyword. In most cases there are still clicks occurring outside of our Shopper Insight Maps (we only see those which correspond to the top 3 clicked ASINs). But, by looking at this data for keywords over time, especially their click/sales share percentages, you are able to develop a great understanding of how customers are shopping for each keyword.
How can you use Shopper Insight maps to drive more sales?
Understanding how customers are shopping for your keywords is powerful knowledge. Seeing how deep customers are shopping per keyword lets you know exactly where you can and cannot rank to drive significant sales. This gives you more granular keyword insights to help you make better product research decisions. Imagine sourcing a product where customers consistently only shopped among the top three ranking products. That would mean you have to compete against the best of the best, or you might as well not be ranking at all. Or, imagine being able to find keywords you once thought were too competitive, but you can now see that customers are consistently shopping at easier-to-rank positions.
We used to determine sales depth by sales estimates, but these are not keyword specific. Shopper Insights gives you the granularity you need to make smarter keyword decisions!
2. Competitor Insights (Manipulated Keywords and More)
The insights we’ve uncovered in Brand Analytics are extensive. There’s a lot to be learned about competitors (and any Amazon black hat tactics they may engage in) and customer purchasing decisions. In our Brand Analytics Shopper Insights reports, we provide this analysis on each keyword market, so the value is significant to say the least.
Manipulated Keywords
There are a slew of seller activities that violate Amazon’s Terms of Service (TOS) used to game various aspects of selling on Amazon. From review manipulation tactics to tactics used to game the keyword rankings.
One such tactic is Click Fraud: bots which run searches, click into the target product, and perform specific behaviors. This results in a lift in keyword ranking for the product EVEN without a purchase. This is a tactic we DO NOT advise using (it should go without saying that we do not advise using any of these tactics). Every so often, this tactic fades in and out of effectiveness. With Brand Analytics we can easily identify if certain products/sellers are using this technique to try to boost keyword rankings.
The three indicators that there is manipulation for a keyword is:
- 0.00% conversion share
- the product is not ranking in the top two pages or running sponsored ads
- Significant click share (e.g. > 60% clicks share to a single ASIN)
There are a number of highly-searched keywords such as “iphone charger” in which we estimate the search volume in to be near 1,000,000 searches per month, however, we find the #2 and #3 most clicked ASINs both received 0.00% conversion share! No way!
Reason #1: The fact that the products with the second and third most clicks have 0.00% of sales is a big indication of manipulation. However, it is possible to have clicks but no sales if customers are purchasing a variation of the clicked ASIN. For example, if customers click on product XYZ, but end up purchasing variation ABC, then XYZ will record the clicks, but not the sales.
Reason #2: These products are not ranking organically in the top few pages. In fact, these products are not ranking in the top 100 results! Nor are these products running sponsored ads. If these products are so buried in the results but are receiving assumedly tens of thousands of clicks, then something unnatural is happening here.

It is apparent to us that these products are being manipulated to try to boost the overall keyword ranking without spending money to drive sales. It’s now easy to detect when competitors are trying to manipulate the search results so you can report them to Amazon thanks to Brand Analytics.
Sponsored Ad Rank Impact
Ever wondered how large of an impact sponsored ads have on your market? For some product markets, it appears as though sponsored ads help to drive a significant portion of traffic. But for others, it appears as though customers pay less attention to sponsored ads, meaning they do not drive significant market share.
Here is an example of a product that was the #3rd most clicked ASIN receiving more than 10% Click Share. However, the product never ranked higher than position #10 organically for the given keyword. But, this product did consistently rank in the first sponsored ad position throughout the given timeframe. This means that through sponsored ads alone, the product was able to drive more market share than products ranking organically.


As you can see, the product was able to take more than 10% of the clicks for the market without ranking above the 10th position organically.
Should You Run Sponsored Ads if You’re Ranking Well Organically?
A big question among successful sellers is whether or not you should run sponsored ads for a keyword if you are organically ranking in the top one or two positions? With Brand Analytics you might be able to answer that question!
We found multiple instances in which customer’s ASINs, that were organically ranking in top positions, drove greater conversion share when they also ran sponsored ads in the first or second ad position. Weeks in which the ASINs were not being advertised, the ASINs saw a smaller conversion share.
Note: It is not possible to detect sponsored ad impact if the top ranking products are also the top ranking sponsored results.
Review Count, Review Rating Impact
For some keywords, you can see that there is a strong relationship between conversion share and review rating. Let me explain. For some product markets, shoppers are more sensitive to review ratings than in other markets. This is wildly insightful! In the past, there was no way to drill this deep into how customers are making buying decisions on a keyword basis. This is another data point that should absolutely impact your decisions, like whether or not to jump into a product market or whether or not a keyword is worth trying to rank for.
Here is an example keyword market where review rating appears to have an impact on conversion rate.

The larger the circle, the higher the conversion share. The higher up in the chart, the higher/better the review rating. The fact that the products taking more market share (the larger circles) are consistently the products with the higher review rating (displaying higher in the chart) points to a strong relationship.
Here is an example of a keyword market in which there is no consistent relationship.

As you can see, there are plenty of instances in which products with better review ratings (circles showing higher on the chart) in this market take a greater share of the sales (larger circles). This indicates that there are factors other than review rating as the largest drivers of sales.
Want to see the relationship between conversion share and review rating for your main keywords? Check out our Shopper Insights report.
Giveaway Detection: What really drives keyword ranking?
We’ve always believed that the largest driver of keyword rankings is the number of orders a product receives. While I still believe this is true, after looking at some of our data science team’s charts, it’s hard to not feel like the primary metric is relative conversion share. We see a number of instances in which a product showing around position 150 organically sees a significant percentage of the conversion share and then a corresponding significant increase in the organic keyword rankings.


The highlighted product has a significant percentage of the conversions (~80%) and jumps from ranking in position 204 to position 5. The product was not running sponsored ads during this period, which makes it apparent that the seller was using some sort of promotion to drive a significant share of the keyword’s sales while ranking so low in the results.
Want to get a notification when a competitor runs a promotion to boost ranking? You can setup product notifications for competitors with our new Competitor Intelligence tool.
3. Validation for Search Volume Estimates
For Google and Amazon, keyword search volume estimates have been around for many years. Google provides estimated search volume numbers via their Google Keyword Planner. In the Amazon ecosystem, sellers have had to rely on third party tools to estimate the search volume and importance of keywords. Brand Analytics answers some of the questions that sellers have around keywords.
Search volume answers three questions
- What words are important for my product
- How important is each keyword
- How do I prioritize one keyword over the next
The beauty of Brand Analytics is the ability to know relatively that Keyword A is more important than Keyword B thanks to Search Frequency Rank. However, the question still remains, exactly how important is each keyword. If Keyword A has 1,000,000 searches/month or 1,000 searches/month, it may significantly impact your keyword and PPC strategy.
While third-party search volume estimates, are just that, estimates, one major benefit Brand Analytics offers sellers is the ability to judge the accuracy of various third-party keyword tools against Brand Analytics. While no tool is going to be perfect, hopefully BA can help you bridge the gap.
4. Estimate Total Clicks and Sales Per Keyword!
While Amazon sales estimates are cool, we’ve always dreamed of having estimated sales per keyword. The problem has been the lack of a quality data source to indicate the amount of sales being driven through each keyword. Through Brand Analytics, in the right scenario, you can actually estimate the total number of clicks and sales on a keyword basis for your market.
If an ASIN for a specific keyword and date range is:
- Not ranking well organically (e.g. not ranking in the top 15 positions)
- Is running aggressive sponsored ads (i.e. displaying in the first two ad positions)
- And has a top 3 click share (#1, #2, or #3)
The seller is able to visit their sponsored products campaign and see how many clicks they received for the target keyword during the given timeframe. Once the seller has the number of clicks, they can divide that by the click share percentage found in Brand Analytics for that keyword.
So for example, let’s say ASIN XYZ was the 3rd most clicked product for the keyword “grill brush” during the first week of March, driving 11.27% click share. Throughout the week, ASIN XYZ ranked organically in the 17th position on average, but it consistently held the 1st ad position. This means it is unlikely that many clicks came from organic ranking. Most clicks were likely driven from the sponsored ad results. When looking at the search term report, the sponsored ads for ASIN XYZ drove a total of 2,000 clicks during the first week of March.
If 2,000 clicks is approximately 11.27% (2000 / .1127), then there are approximately 17,746 organic clicks for the week for that keyword. (We would assume click share does not take into account clicks from Product Pages, but we could be wrong).
The same could be done for estimating the number of sales/conversions keyword by looking at the number of PPC sales for the keyword divided by the product’s conversion share percentage.
Super cool, right? Let me know what you think in the comments!
Conclusion
We’ve discussed A LOT in this post. If you take nothing else away, I hope we’ve helped to open your eyes to the fact that there is a wealth of information contained within your Brand Analytics reports. Hopefully you better understand the importance of analyzing your keyword markets at a more granular level to truly discern how customers are shopping for your product. For some keywords, there’s no point in fighting for the first organic rank position because significant clicks and sales are happening in the top 15 results. Whereas for other words, if you are not ranking in the top 3, then you might as well not be ranking at all.
Let us know in the comments if you’re interested in a webinar or additional blog posts walking through some of these items and more in additional detail. We’d love to hear your thoughts and questions!
This has been a major step by Amazon to help provide the seller community with insights into real customer shopping behavior. While there are a lot of insights we uncovered in this post, I imagine our brilliant seller community will be able to identify even more. The only stipulation is that it takes a bit of massaging and combining the data with other metrics (e.g. rank position, sponsored ad rank, etc.) to truly extract the value out of these reports.
There is an incredible amount of actionable insights locked within Brand Analytics to help you make better decisions to improve your sales, market share, and more.
That’s why we are offering our new service to process your Brand Analytics to provide you with an in depth report on your most important keywords. Our Shopper Insights report will give you the data and actionable insights you need to make better sourcing, keyword research, advertising, and ranking decisions.
Contained within each Shopper Insights report is:
- Sponsored Ads Market Share Impact
- Giveaway Detection
- Top Performing ASINs Analysis
- Shopping Heat Map
- Review Rating to Sales Relationship Analysis
- And more!
Note: You must have access to Brand Analytics in order to sign up for your Shopper Insights report.