Amazon Advertising: Brand Analytics & Customer Behavior

There are incredible insights buried within Amazon Brand Analytics that you can use to make smarter decisions and real improvements.

TL;DR: If you’re a brand-registered Amazon seller, you may now have access to Amazon Brand Analytics in Seller Central. There are incredible insights hidden within this data… like real customer shopping behavior, competitor insights, and even the potential to estimate total clicks and conversions per keyword! You can use these insights to start making smarter decisions and real improvements today. With our new Data Science as a Service (DSaaS) model, Viral Launch will process your Brand Analytics data, return a detailed shopper insights report, and reveal the massive golden nuggets hidden within your Brand Analytics. Please note: You must sell on Amazon.com and have access to Brand Analytics to be eligible.

One of my favorite things about data scientists is their ability to look at the world through a unique lens; a lens capable of transforming mildly interesting, yet disparate, information into incredible and profound insights. If you have ever struggled to understand the meaning of a piece of abstract art as others talk about how exquisite and meaningful the artwork is, or tried reading a restaurant menu written in a foreign language when visiting abroad, then you understand how possible it is for two people to see the exact same data, yet arrive at completely different conclusions.

Amazon’s Brand Analytics is the perfect example of data we all “know” could be valuable, yet we didn’t know exactly why it was valuable or what actions to take with this new found information.

Once our data science team got their hands on a Brand Analytics report for a client, an incredible world of mind-blowing insights began to unfold. After reading through this post, you’ll never look at your market’s keywords the same.

Table of Contents

  1. What is Amazon Brand Analytics
  2. What is Inside Brand Analytics
  3. 4 Powerful Brand Analytics Insights
  4. Conclusion

What is Amazon Brand Analytics?

Brand Analytics is a free report available within Seller Central for sellers in Amazon’s Brand Registry program (it is still being rolled out to all accounts).

The data provided in Brand Analytics is interesting but alone is hardly actionable and quite clunky. As a results-driven company, our brilliant data science team is obsessed with deriving results-oriented insights from all things data. They were able to turn this interesting data into game changing insights that will change the way you look at keywords, allow you to better understand your market’s customers, and ultimately, make better decisions to drive more sales and profitability for your business!

There are four incredibly valuable insights the data science team was able to pull from Brand Analytics that the average seller would normally miss. We’ll get to those in just a moment.

Important Note: We could not share any specific information in this blog post to comply with Amazon’s Brand Analytics Terms and Conditions around confidentiality. All examples align very closely to the various insights we are able to develop from customer’s Brand Analytics reports.

What’s Inside Brand Analytics?

Amazon’s Brand Analytics is available to 3P sellers that are enrolled in Amazon’s Brand Registry program. It is still being rolled out to all accounts, but if you do have access to this new report, it can be found by visiting: Brand Analytics.

Here is a breakdown of each component in the Amazon Search Terms report.

  • Search Term:  This is the keyword an Amazon shopper uses when looking for a product. The keyword can be an individual word such as “iphone” or a phrase such as “iphone Xs case for women”.
  • Search Frequency Rank (SFR): Search Frequency Rank is reminiscent of Amazon’s Best Seller Rank (BSR) in that it calculates the popularity of one keyword relative to keywords around it. This means that the keyword with a SFR of #3 is more popular during the given timeframe than a keyword with a SFR of #5. Amazon does not provide the number of searches for a particular keyword, but the relative rank is still very helpful!
  • #1 Clicked ASIN: This field is designated for the ASIN that received the most clicks from shoppers who searched this keyword. This field does not mean that the product was ranking in the first organic position.
  • #1 Product Title: This is the product title of the #1 clicked ASIN.
  • #1 Click Share: Amazon provides the percentage of total clicks that the #1 most clicked ASIN received. This percentage is calculated by looking at the total number of clicks after customers searched the given keyword. This does not indicate the total Click-Through Rate (CTR) of the ASIN. The Click Share is the percentage of total clicks that this ASIN saw for this keyword’s searches alone.
    • If 1,000 customers searched the keyword “fish oil”, and each of those customers clicked into two products (2,000 clicks total), and Product XYZ received 500 clicks from said customers, then the click share for Product XYZ for the search term “fish oil” would be 25% (500/2000).
  • #1 Conversion Share: Conversion Share is slightly different as it does not inherently represent the ASIN that received the most conversions for the given search term. It represents the percentage of total sales the #1 Clicked ASIN received for the given keyword.
    • If there are a total of 1,000 sales from customers who searched “fish oil,” and the #1 most clicked ASIN saw 100 of those sales, that #1 Conversion Share would be 10%. It is possible that the most clicked ASINs do not drive the most conversions for the given search term.
  • #2 & #3 Most Clicked: Amazon provides the #2 and #3 most clicked ASINs for each keyword including their Product Title, Click Share and Conversion Share.

4 Powerful Brand Analytics Insights

1. Customer Shopping Behavior: Heat Maps

Imagine having a heat map for every Amazon keyword to know exactly how customers are shopping. Imagine being able to answer questions like:

  • Does the first ranking product always get the most clicks? Most sales?
  • Does it vary by keyword?  
  • Do I have to be ranking in the top 5 to see good sales volume? Top 15?
  • I’m ranking in position #7, why am I not seeing any sales?
  • How much market share can I take with sponsored ads alone?

While at face value it doesn’t appear as though the Brand Analytics report provides this type of insight, our data science team was able to combine a variety of data sources to produce possibly some of the most interesting and insightful data the Amazon seller community has ever seen. We’re calling this new data Shopper Insights.

Shopper Insight Heat Maps

Here is an example Shopper Insights Map for the keyword “gifts for men”. While we can’t share exact data, this is the type of map similar to keywords like “pajamas for kids”, “easter baskets”, and “women’s dresses” in which customers must do some shopping before making a purchasing decision.

As you can see, people are shopping all the way down to the 27th ranked product. We’ve also seen Shopper Insights Maps where customers are shopping much further down.

One of the first things you’ll notice is the 9th rank position on average is seeing a higher conversion share than the second and third rank positions.

You might be asking how/why the click share and conversion share do not add up to 100%, which is completely understandable. It all comes down to the way in which we build out these heat maps. There are two contributing factors: 1) keywords do not usually maintain a single ranking position throughout the entire week. 2) We show the weighted average click and conversion share at each rank position. What this heat map does not show is the number of weeks in which we found top ranking ASINs in each position. You can find more details on how we build these heat maps down below.

The map above becomes quite a bit more interesting when you look at it next to the heat map for another keyword like “toothpicks”. While we can’t share exact data, think of the keyword “toothpicks” alongside keywords like “AA batteries”, “iPhone charging cable”, (i.e. commodity products) in which there is little decision-making or style preference involved in the buying decision.

This map is telling us that, on average, the most trafficked products are consistently ranking between the first three organic positions. The color indicates the weighted average conversion share from customers searching “toothpicks” that purchase the products found ranking at each position. You will notice a blank space between positions #3 and #5 indicating that on average products ranking in the fourth positions have not driven many clicks.

This data is extremely valuable as it tells “toothpick” sellers that the vast majority of purchases occur within the first 6 ranked products. This means that if you wish to drive sales through this keyword, ranking in the top 10 alone is not going to cut it. You have to be ranking within the first six positions. And logically, this makes sense.

Toothpicks are toothpicks. How large of a selection do shoppers really need when purchasing commodity type products?

While “toothpicks” may be an obvious example where customers require little shopping, we’ve seen plenty of examples for style-heavy products like “stroller.” At first, you may think style plays a major role in buying decisions, but this market actually has very shallow sales depth. In this example, we see that a large amount of shopping is being done in just the top four ranking positions (with the second ranking position seeing the most action on average for this group).

The old strategy was to look at the sales estimates/BSR of the products showing in the organic rankings to determine sales depth. The problem is that sales/BSR show sales driven from all keywords. This doesn’t inherently indicate how customers are shopping for a specific keyword. Shopper Insights Maps completely solve this problem. Through this Brand Analytics data, combined over time, we are able to see the sales depth for that keyword and build a ranking strategy around it.

Here are a couple other heat maps to show you drastically they can vary:

Here is a market with good sales distribution as customers are shopping well into the first page of results.

Here is a market where customer’s are shopping to only the 5th result. (notice the “Low Data” message starting at thee 6th rank position)

Here is a market where the 5th rank position’s average conversion share is greater than the first rank position. The 7th rank position has the greatest average conversion share, however, there was only 1 of 12 weeks in which we found a top three most clicked ASIN indicating much less frequency at that position.

Here is a market in which there are strong sales all the way through the 25th position, however, it’s very important to pay attention to the number of weeks a top product was found in each position. This indicates there is a lot of volatility in the ranking results.

How do we build these Shopper Insights maps?

When working with a seller, we first compile their Brand Analytics reports from the past 90 days. Then, we look at the historical keyword rankings for the most-clicked ASINs per keyword along with the date range that those ASINs appeared.

Let’s take the week of 3/03/19 – 3/09/19 for the keyword “garlic press” (~220k searches/month) in which ASIN: XYZ was the #2 most clicked (2nd most click share). We then use our new reverse ASIN and competitor monitoring tool to identify where that ASIN was ranking during that given time period. This product spent most of the week ranking in the 1st organic ranking position, so we attribute the click share and conversion share to the #1 ranking position.

For the same week, the 3rd most clicked ASIN DEF, as you can see in the screenshot below, spent most of the week ranking between position 7 and 8 using our Competitor Intelligence tool.

And the #1 most clicked ASIN ABC spent the majority of the week ranking in the 3rd organic ranking position for the keyword “garlic press” so we have attributed their performance metrics to the third ranking position.

So after just one Brand Analytics weekly report, seeing just three ASINs, here is what our Shopper Insights heat map would look like.

As you can see the “Rank Position: 3” box is the darkest with the highest conversion share which was derived from the stats of the #1 most clicked ASIN in the week.

The “Rank Position: 1” box has the second highest conversion share and represents the stats of the #2 most clicked ASIN.

Representing the #3 most clicked ASIN, there are two boxes filled in “Rank Position: 7” and “Rank Position: 8”. Both boxes are filled in because the product spent a good portion of the week ranking in the #7 position as well as the #8 position.

Now, imagine building this report 11 more times for each of the 12 prior weeks of Brand Analytics reports for the keyword “garlic press”. The top clicked ASINs may change over time, and where the most clicked ASINs ranked in the search results will likely also change. The data science team layers on these 12 reports on a keyword basis to develop the final “heat map”

It’s important to note that the given depth is not total depth. Depth is key, and it is based on the most clicked products for each keyword. In most cases there are still clicks occurring outside of our Shopper Insight Maps (we only see those which correspond to the top 3 clicked ASINs). But, by looking at this data for keywords over time, especially their click/sales share percentages, you are able to develop a great understanding of how customers are shopping for each keyword.

How can you use Shopper Insight maps to drive more sales?

Understanding how customers are shopping for your keywords is powerful knowledge. Seeing how deep customers are shopping per keyword lets you know exactly where you can and cannot rank to drive significant sales. This gives you more granular keyword insights to help you make better product research decisions. Imagine sourcing a product where customers consistently only shopped among the top three ranking products. That would mean you have to compete against the best of the best, or you might as well not be ranking at all. Or, imagine being able to find keywords you once thought were too competitive, but you can now see that customers are consistently shopping at easier-to-rank positions.

We used to determine sales depth by sales estimates, but these are not keyword specific. Shopper Insights gives you the granularity you need to make smarter keyword decisions!

2. Competitor Insights (Manipulated Keywords and More)

The insights we’ve uncovered in Brand Analytics are extensive. There’s a lot to be learned about competitors (and any Amazon black hat tactics they may engage in) and customer purchasing decisions. In our Brand Analytics Shopper Insights reports, we provide this analysis on each keyword market, so the value is significant to say the least.

Manipulated Keywords

There are a slew of seller activities that violate Amazon’s Terms of Service (TOS) used to game various aspects of selling on Amazon. From review manipulation tactics to tactics used to game the keyword rankings.

One such tactic is Click Fraud: bots which run searches, click into the target product, and perform specific behaviors. This results in a lift in keyword ranking for the product EVEN without a purchase. This is a tactic we DO NOT advise using (it should go without saying that we do not advise using any of these tactics). Every so often, this tactic fades in and out of effectiveness. With Brand Analytics we can easily identify if certain products/sellers are using this technique to try to boost keyword rankings.

The three indicators that there is manipulation for a keyword is:

  1. 0.00% conversion share
  2. the product is not ranking in the top two pages or running sponsored ads
  3. Significant click share (e.g. > 60% clicks share to a single ASIN)

There are a number of highly-searched keywords such as “iphone charger” in which we estimate the search volume in to be near 1,000,000 searches per month, however, we find the #2 and #3 most clicked ASINs both received 0.00% conversion share! No way!

Reason #1: The fact that the products with the second and third most clicks have 0.00% of sales is a big indication of manipulation. However, it is possible to have clicks but no sales if customers are purchasing a variation of the clicked ASIN. For example, if customers click on product XYZ, but end up purchasing variation ABC, then XYZ will record the clicks, but not the sales.

Reason #2: These products are not ranking organically in the top few pages. In fact, these products are not ranking in the top 100 results! Nor are these products running sponsored ads. If these products are so buried in the results but are receiving assumedly tens of thousands of clicks, then something unnatural is happening here.

It is apparent to us that these products are being manipulated to try to boost the overall keyword ranking without spending money to drive sales. It’s now easy to detect when competitors are trying to manipulate the search results so you can report them to Amazon thanks to Brand Analytics.

Sponsored Ad Rank Impact

Ever wondered how large of an impact sponsored ads have on your market? For some product markets, it appears as though sponsored ads help to drive a significant portion of traffic. But for others, it appears as though customers pay less attention to sponsored ads, meaning they do not drive significant market share.

Here is an example of a product that was the #3rd most clicked ASIN receiving more than 10% Click Share. However, the product never ranked higher than position #10 organically for the given keyword. But, this product did consistently rank in the first sponsored ad position throughout the given timeframe. This means that through sponsored ads alone, the product was able to drive more market share than products ranking organically.

As you can see, the product was able to take more than 10% of the clicks for the market without ranking above the 10th position organically.

Should You Run Sponsored Ads if You’re Ranking Well Organically?

A big question among successful sellers is whether or not you should run sponsored ads for a keyword if you are organically ranking in the top one or two positions? With Brand Analytics you might be able to answer that question!

We found multiple instances in which customer’s ASINs, that were organically ranking in top positions, drove greater conversion share when they also ran sponsored ads in the first or second ad position. Weeks in which the ASINs were not being advertised, the ASINs saw a smaller conversion share.

Note: It is not possible to detect sponsored ad impact if the top ranking products are also the top ranking sponsored results.

Review Count, Review Rating Impact

For some keywords, you can see that there is a strong relationship between conversion share and review rating. Let me explain. For some product markets, shoppers are more sensitive to review ratings than in other markets. This is wildly insightful! In the past, there was no way to drill this deep into how customers are making buying decisions on a keyword basis. This is another data point that should absolutely impact your decisions, like whether or not to jump into a product market or whether or not a keyword is worth trying to rank for.  

Here is an example keyword market where review rating appears to have an impact on conversion rate.

The larger the circle, the higher the conversion share. The higher up in the chart, the higher/better the review rating. The fact that the products taking more market share (the larger circles) are consistently the products with the higher review rating (displaying higher in the chart) points to a strong relationship.

Here is an example of a keyword market in which there is no consistent relationship.

As you can see, there are plenty of instances in which products with better review ratings (circles showing higher on the chart) in this market take a greater share of the sales (larger circles). This indicates that there are factors other than review rating as the largest drivers of sales.

Want to see the relationship between conversion share and review rating for your main keywords? Check out our Shopper Insights report.

Giveaway Detection: What really drives keyword ranking?

We’ve always believed that the largest driver of keyword rankings is the number of orders a product receives. While I still believe this is true, after looking at some of our data science team’s charts, it’s hard to not feel like the primary metric is relative conversion share. We see a number of instances in which a product showing around position 150 organically sees a significant percentage of the conversion share and then a corresponding significant increase in the organic keyword rankings.

The highlighted product has a significant percentage of the conversions (~80%) and jumps from ranking in position 204 to position 5. The product was not running sponsored ads during this period, which makes it apparent that the seller was using some sort of promotion to drive a significant share of the keyword’s sales while ranking so low in the results.

Want to get a notification when a competitor runs a promotion to boost ranking? You can setup product notifications for competitors with our new Competitor Intelligence tool.

3. Validation for Search Volume Estimates

For Google and Amazon, keyword search volume estimates have been around for many years. Google provides estimated search volume numbers via their Google Keyword Planner. In the Amazon ecosystem, sellers have had to rely on third party tools to estimate the search volume and importance of keywords. Brand Analytics answers some of the questions that sellers have around keywords.

Search volume answers three questions

  1. What words are important for my product
  2. How important is each keyword
  3. How do I prioritize one keyword over the next

The beauty of Brand Analytics is the ability to know relatively that Keyword A is more important than Keyword B thanks to Search Frequency Rank. However, the question still remains, exactly how important is each keyword. If Keyword A has 1,000,000 searches/month or 1,000 searches/month, it may significantly impact your keyword and PPC strategy.  

While third-party search volume estimates, are just that, estimates, one major benefit Brand Analytics offers sellers is the ability to judge the accuracy of various third-party keyword tools against Brand Analytics. While no tool is going to be perfect, hopefully BA can help you bridge the gap.

4. Estimate Total Clicks and Sales Per Keyword!

While Amazon sales estimates are cool, we’ve always dreamed of having estimated sales per keyword. The problem has been the lack of a quality data source to indicate the amount of sales being driven through each keyword. Through Brand Analytics, in the right scenario, you can actually estimate the total number of clicks and sales on a keyword basis for your market.

If an ASIN for a specific keyword and date range is:

  1. Not ranking well organically (e.g. not ranking in the top 15 positions)
  2. Is running aggressive sponsored ads  (i.e. displaying in the first two ad positions)
  3. And has a top 3 click share (#1, #2, or #3)

The seller is able to visit their sponsored products campaign and see how many clicks they received for the target keyword during the given timeframe. Once the seller has the number of clicks, they can divide that by the click share percentage found in Brand Analytics for that keyword.

So for example, let’s say ASIN XYZ was the 3rd most clicked product for the keyword “grill brush” during the first week of March, driving 11.27% click share. Throughout the week, ASIN XYZ ranked organically in the 17th position on average, but it consistently held the 1st ad position. This means it is unlikely that many clicks came from organic ranking. Most clicks were likely driven from the sponsored ad results. When looking at the search term report, the sponsored ads for ASIN XYZ drove a total of 2,000 clicks during the first week of March.

If 2,000 clicks is approximately 11.27% (2000 / .1127), then there are approximately 17,746 organic clicks for the week for that keyword. (We would assume click share does not take into account clicks from Product Pages, but we could be wrong).

The same could be done for estimating the number of sales/conversions keyword by looking at the number of PPC sales for the keyword divided by the product’s conversion share percentage.

Super cool, right? Let me know what you think in the comments!

Conclusion

We’ve discussed A LOT in this post. If you take nothing else away, I hope we’ve helped to open your eyes to the fact that there is a wealth of information contained within your Brand Analytics reports. Hopefully you better understand the importance of analyzing your keyword markets at a more granular level to truly discern how customers are shopping for your product. For some keywords, there’s no point in fighting for the first organic rank position because significant clicks and sales are happening in the top 15 results. Whereas for other words, if you are not ranking in the top 3, then you might as well not be ranking at all.

Let us know in the comments if you’re interested in a webinar or additional blog posts walking through some of these items and more in additional detail. We’d love to hear your thoughts and questions!

This has been a major step by Amazon to help provide the seller community with insights into real customer shopping behavior. While there are a lot of insights we uncovered in this post, I imagine our brilliant seller community will be able to identify even more.  The only stipulation is that it takes a bit of massaging and combining the data with other metrics (e.g. rank position, sponsored ad rank, etc.) to truly extract the value out of these reports.

There is an incredible amount of actionable insights locked within Brand Analytics to help you make better decisions to improve your sales, market share, and more.

That’s why we are offering our new service to process your Brand Analytics to provide you with an in depth report on your most important keywords. Our Shopper Insights report will give you the data and actionable insights you need to make better sourcing, keyword research, advertising, and ranking decisions.

Contained within each Shopper Insights report is:

  • Sponsored Ads Market Share Impact
  • Giveaway Detection
  • Top Performing ASINs Analysis
  • Shopping Heat Map
  • Review Rating to Sales Relationship Analysis
  • And more!

Get your new competitive advantage!

Note: You must have access to Brand Analytics in order to sign up for your Shopper Insights report.

The Future of Amazon 2019: 22 Sellers and Thought Leaders Share Their Predictions

For brands and entrepreneurs selling on Amazon, 2018 was a whirlwind of change with increases in competition, old success tactics becoming obsolete, new Amazon programs, and so much more. If history is any indicator, then we can expect even more of these changes in the new year. But what sorts of changes should we expect? How will these changes impact your Amazon business? And what steps should you be taking to prepare for these changes to best get ahead of the competition?

Here at Viral Launch, through helping drive more than $7 billion dollars in Amazon sales, we’re equipped with a vast amount of insight and data. This experience working with thousands of brands (from small private label sellers, to $100m+ 3rd party sellers and world renowned Fortune 100 brands) has enabled us to predict some of the biggest things to come in 2019. And we want to share them with you so that you can prepare for what’s ahead this year.

Not only that, but we teamed up with more than twenty 7, 8, and 9 figure sellers and Amazon thought leaders to get their unique perspectives on what to expect and how to prepare for success in the coming year. So, here are 11 predictions for Amazon in 2019 to inform your business decision making, formulated by Viral Launch and informed by top industry experts.

Click Here to Read the Experts’ Predictions

1. Major Brands Get Smart About Amazon Organic Ranking & Sales

We are predicting there will be more major brands that get smart about Amazon success tactics, putting even more pressure on Amazon sellers!

The reason third-party sellers (the small private label sellers) have had the opportunity to become ecommerce giants (we have a couple private label customers and personal friends that surpassed $100m on Amazon in 2018) is because when Amazon changed the ecommerce game, they changed the necessary tactics that drive success.

In a lot of ways, the primary tactics used in traditional retail – such as paying for shelf space, good in-person packaging, and branding – gave way to lower prices, organic keyword ranking, and pay per click/direct response advertising.

Amazon third-party sellers have been able to drive massive success because their only chance of driving sales among such established players was to become students of the new paradigms of retail success tactics. These sellers have worked diligently to understand the key drivers of Amazon organic keyword ranking and conversions, which has led to significantly greater visibility than their household name competitors.

Major brands continue to use deprecated success techniques, leaving the door wide open for third party sellers to reap the benefits of their Amazon expertise. Major brands typically only pay attention to Amazon PPC as their most impactful lever of driving sales. However, in general, only 15-40% of a product’s sales potential comes from Amazon advertising, while the remaining 60-85% can be found in the organic search results. It’s within this uncontested 60-85% space that third-party sellers have thrived and grown.

We are seeing more of these larger brands realize that there is far more potential beyond just Amazon advertising sales. They are beginning to hire successful Amazon sellers and/or software providers as consultants in order to help them become experts, much like successful third-party sellers. This is causing them to shift their focus from the 15-40% of sales potential to 100% of sales potential.

2. Amazon PPC Becomes Less Profitable But More Important

We are predicting that advertising on Amazon will see an increase in efficiency, significant increases in cost, and a significant increase in importance to success for brands on Amazon.

As Amazon increases their dominance in ecommerce and retail, brands are forced to move more of their budget to Amazon advertising. Significantly increased demand, combined with inefficient spend of untrained brands, will absolutely result in increased CPCs (cost-per-clicks). We’ve been observing this trend for quite some time in many markets, but we expect it to increase in velocity and ubiquity. It’s hard to go more than a week without seeing a new post in the media about Amazon’s advertising platform. With that said, we do think that while costs will increase, efficiency will improve.

Viral Launch still sees significant inefficiencies in general Amazon advertising campaign management, largely due to the limitations of Amazon’s in-house advertising tools and programs as well as a lack of sophisticated ad management and automation alternatives. However, we expect new tools/improved sophistication and functionality in Amazon advertising tools and programs will allow for an improvement in advertising spend efficiency. We also expect Amazon to continue improving their ad targeting technology with new programs and tools which will help brands improve overall spend efficiency.

Additionally, we believe that advertising on Amazon is and will continue to be increasingly more important to being competitive on Amazon. With more ad placements per page, we expect advertising to continue increasing the share of an individual product’s sales potential versus organic sales potential. Advertising can also be an important tool in affecting organic sales. Brands that have been using purely organic traffic to build their business will be forced to become experts at Amazon advertising in order to remain ahead of the competition.

3. The Reign of Building Brands Off Amazon

We are predicting that more Amazon sellers will focus on building brands off of Amazon as the effort/reward ratio continues to improve relative to the ratio of focusing solely on Amazon.

Up until 2018, Viral Launch has been a major advocate for focusing on Amazon and delaying true brand building until you crossed the $10m mark on Amazon. While we had obviously seen a few brands build success using a multi-channel strategy (selling outside of just Amazon), it was extremely rare. Much more frequently, sellers hit 7 and 8 figures ($10,000,000+)  while focused almost exclusivelyon selling on Amazon. Opportunity cost is a powerful metric for optimal decision making, and for the vast majority of sellers, the opportunity cost was too high when focusing off of Amazon. The reason was because selling on Amazon still presented a lot of low hanging fruit and provided revenue growth rates you could hardly ever reach anywhere else.

As selling on Amazon has become increasingly competitive, we feel that the scales of opportunity cost are shifting to point to true brand building as the greater opportunity. Now don’t get me wrong, there are more people spending more money than ever on Amazon. The opportunity is greater than ever, but the cost and effort of seizing the opportunity is also greater than ever (in most markets).


4. Successful Brands Will Continue to Grow Significantly

We are predicting successful sellers/brands will see unparalleled sales volume on Amazon!

While it’s true that selling on Amazon has become more difficult than ever, there are more people spending more money on Amazon than ever before. This trend will continue into 2019, meaning those brands that are able to achieve/maintain top organic ranking positions, as well as perform well in advertising, will see sales volumes at unparalleled levels. The stakes are higher than ever! It truly is an exciting time to be selling successfully on Amazon.

5. Fewer New Entrepreneurs Begin Selling On Amazon

We are predicting fewer new Amazon seller accounts will be created in 2019.

According to Marketplace Pulse there were 1,200,000 Amazon seller accounts created in 2018 (a good portion never saw a sale). We are expecting new account creation to slow down quite a bit.

There are three primary reasons we expect this to happen.

  • Reason 1) Increased Barrier to Entry: the cost and complexity of driving success on Amazon has increased. While we still believe there is a massive amount of opportunity on Amazon still (see Amazon Product Research in 2019), the opportunity generally requires larger budgets and more complex strategy.
  • Reason 2) Market Fatigue: There are only so many aspiring entrepreneurs and mom and pop shops that are interested in selling on Amazon. We are predicting that the interest peaked in these two demographics in 2018.
  • Reason 3) While we are not economists or fortune tellers, the possibility of a global/US based financial downturn is looming. In the event of a financial downturn, we expect people to have less “free cash” available to start an Amazon FBA business.

6. Major Changes in Reviews and Rankings

In 2019, we think Amazon will continue to improve the security/integrity around many systems/processes including their coveted reviews.

While we have been expecting Amazon to make a major systemic change to their review system, we are guessing (and hoping) that 2019 is the year we see this change come to fruition. In 2018 we have seen some review changes, specifically around review locks, in which receiving too many reviews will trigger Amazon to put a lock on new review activity.

We expect many unforeseen changes to take place, however our greatest hope/prediction is for Amazon to change the review system to a LinkedIn-style review cap presented on search results. By this, we mean that on search results pages, we expect Amazon to begin showing review quantities over 1,000 reviews as 1,000+ (or some similar number). You can check out our Amazon review podcast covering why we think this is necessary to protecting the quality of products purchased and the integrity of Amazon’s review platform for more on that topic.  

In short, sellers are incentivized to achieve the highest review quantity relative to their competitors. A higher review quantity indicates greater popularity to potential buyers. If a product has been selling for 10 years on Amazon, it has a distinct advantage over new, and potentially better, products that have not had as long to generate reviews. Let’s say Product A has been on Amazon for 5 years, has a 4.4 star rating, and 6,000 reviews. While Product B has been on Amazon for 6 months, has a 4.8 star rating with 1,000 reviews and a price point $1.00 cheaper than Product A. While most may think Product B is a better product at a better value, there is very little hope of Product B gaining the sales necessary to acquire the reviews to outperform Product A. Product A could allow the quality of their product to decrease because they have such a large review quantity built up that it will be very difficult for others to catch up. It creates a stale market favoring age over quality and value. Limiting to 1,000 reviews shown in the decision process would allow customers to know that a statistically significant number of other customers have purchased/reviewed the product so that review rating must be legitimate.

While we do not have many specific predictions we feel comfortable sharing, we do expect there to be rather significant shake ups in the key drivers of Amazon’s organic keyword ranking algorithm. As in the past, having access to significant amounts of data around key ranking factors/metrics while constantly testing will be the key to staying ahead of any algorithmic changes. Fortunately, Viral Launch has been able to stay abreast of any changes thanks to our wealth of data and brilliant R&D team.

7. Facebook Begins It’s Path of Becoming The Second Largest Ecommerce Site

We are predicting Facebook begins making big moves in ecommerce by subsidizing sales through their platform for merchants to sell direct through their platform.

For the last couple of years, we’ve consistently considered Facebook to be the entity with the greatest potential to challenge Amazon in the world of retail. We’ve lost quite a bit of hope in Walmart and Google over the years. If you think through the core building blocks to a successful ecommerce platform, attention, data, trust, and web/mobile capabilities/technology are top of the list. With more than a purported 2 billion monthly active users, unparalleled data around it’s users, and significant web and mobile technology, Facebook is more than well equipped to help brands sell their goods directly through their platform at a massive scale.

I’m not talking about Facebook’s peer-to-peer marketplace. I’m expecting a full fledged Amazon competitor, and we’re beginning to see the early stages. In some instances, Facebook is reimbursing merchants $5 for each product sold to cover the cost of shipping with no additional marketplace fees, making Facebook a cheaper place to move product already. We’re expecting Facebook to start making some big moves in the e-commerce world in 2019.

8. International Markets are the New Gold Rush

We are predicting a substantial movement of third-party Amazon.com sellers in offering their products and brands on Amazon’s international marketplaces in 2019.   

Selling on Amazon.com (the US marketplace) still poses massive opportunity if played right, but there is no denying that it is certainly more difficult to grasp that opportunity than ever. We expect the real mad rush for low hanging-fruit sales (Amazon “gold”)  will come in Amazon’s international marketplaces. Viral Launch has been a strong advocate of sellers expanding internationally for the last two years, which is why we invested in hiring domestic listing optimization specialists in each country containing a major Amazon marketplace, as well as expanding our tools to work internationally. We have seen success after success with minimal effort and marketing budget in Amazon’s international markets over the last couple of years (check out this incredible story of two 21 year olds achieving 8 figures on Amazon in 2 years, while selling internationally).

As creating and expanding a profitable and high-growth Amazon business becomes more difficult to achieve on Amazon.com, we think 2019 will finally be the year that third-party sellers look to international markets in droves!  Selling internationally certainly has some drawbacks, but in general, Amazon advertising is significantly cheaper, driving organic keyword ranking is significantly easier, and growing top line revenue are all much less competitive relative to Amazon.com. Experienced Amazon.com sellers are able to use their learned success tactics and easily apply them to their brands in International markets.

9. Seller Fulfilled Prime Comes Into Vogue

We are not denying the importance of 1-hour and same day delivery, but we predict we will see a significant amount of sellers over the $1m mark moving to a hybrid fulfillment model.

Over the last 6-9 months, we’ve started to observe a trend in larger/more experienced Amazon third-party sellers moving to the Seller Fulfilled Prime (SFP) model using a combination of their own warehouses and 3rd Party Logistics providers (3PLs). The most compelling reason to move from fulfilling through Amazon’s FBA program to a self-regulated SFP model is cost savings.

We are not seeing only sellers with large items such as furniture moving to SFP, but sellers with products of all weights and dimensions. A customer of ours, selling more than $40m/year on Amazon, claims moving to the Seller Fulfilled Prime model has been his single best investment yet!

The second most common reason sellers are taking up SFP is to support fulfillment for other ecommerce channels that may not allow using Amazon’s Multi-Channel Fulfillment program. Having a dedicated 3PL network allows sellers cheaper fulfillment and greater channel flexibility.

10. More Amazon-Owned Brands

We are predicting there will be a significant increase in the number of Amazon owned (not “sold by Amazon”) in 2019.

We have seen a significant push from Amazon in their own private label brands, and we expect to see this trend continue into 2019. Amazon now has over 80 of their own private label brands, and those brands are receiving better placement than ever (Amazon’s “Our Brands” section now shows above organic results for many search terms).

Amazon kicked off a new program near the end of 2018 called their Accelerator Program, which essentially stands as a partnership between third-parties and Amazon to establish new Amazon-owned brands using existing product performance data. This presents the potential for the number of Amazon owned brands to sky rocket! It will be very interesting to see how this progresses in the new year.

The largest threat to Amazon’s private label brands is likely the government presiding over the country in which each marketplace operates. For example, India has banned Amazon from selling any of its own products on Amazon.in.

11. Less Ads Showing on Page 1 of Search Results

We are predicting Amazon reduces the Amount of clutter in Amazon search results which distracts shoppers from the organic search results.

This is not a common opinion, and we’ll admit that there is a decent amount of logic/data pointing to an extremely high probability that this prediction does not come true, however, when we really try to get in the mind of Amazon and Jeff Bezos, this feels right! I (Casey Gauss) want to walk you through my logic on this one.

As I think through what has made Jeff and Amazon so successful, it’s been their relentless focus on the customer experience (think lower prices, faster shipping, return policy, etc.).

In my opinion, in 2018, the actual shopping experience for customers suffered at the expense of Amazon’s advertising revenue and the promotion of their owned products. There are two contributing factors to what I believe is a lower quality shopping experience.

(One key point to understanding my thoughts below is the difference between “organic results” and “sponsored results”. “Organic results” are the items presented to a customer after typing in a given search term that are showing in the results out of merit. Organic results have been selected by Amazon’s A9 ranking algorithm based on performance factors such as conversion rate, number of units sold, etc. “Sponsored results” are items showing with a “sponsored” denotation, and are showing in the results because merchants have paid for the placement. Theoretically, organic results are the best selling products for a given keyword which is why they are showing in the results. The products most likely to best satisfy the customer’s request. While Sponsored results are artificially placed based on how much the merchant is willing to spend.)

1) Overwhelming Information in Results: In general, our data shows that anywhere between 60-85% of a product’s sales potential come from placement in the organic search results. This means the majority of customers’ shopping experience consists of inputting search terms in the search bar (e.g. “fish oil supplement”), sifting through the results, and purchasing a product. In 2018, we saw an increase in the amount of information being shown on the results page which can be confusing, overwhelming, and a barrier to purchasing the products showing organically (the most likely to satisfy the customer’s request based on real buyer behavior).

The shopping experience is overwhelmed with information and creates a barrier to the shopper arriving at the best performing products based on real data from hundreds to millions of real customers. I feel this direct and indirect inhibition to the best customer experience does not align with Amazon’s mission and what has allowed them to be so successful to date.

2) More Sales Through Amazon Ads: There are more advertising placements on Amazon than ever before. Paid media sales are increasing their market share versus organic sales. When customers are purchasing artificially placed products (products presented through ads versus showing based on performance), the probability of the sponsored product being as high quality as an organically ranked product is low. By more sales being driven through advertising, Amazon is selling less of the proven and theoretically higher quality “organic results” to customers for the sake of driving more advertising revenue. More ad sales = more pay to play, versus quality & value to play.

Now, I don’t think that Amazon has nefarious intentions with advertising. They haven’t set out to create a lower quality shopping experience so they can make a few billion dollars more per year. My assumption (with almost no inside Amazon insight) is that this is a classic case of competition priorities between departments (i.e. the Amazon advertising business units are focused on maximizing their top line, without much focus on the overall customer experience).

Either way, I’m predicting that someone in Amazon, perhaps Mr. Bezos himself, will realize that there has been a slight deviation from the company’s overall focus, and will begin to peel back some of the excessive ad placement.

12. Amazon Significantly Outpaces Other Retailers in an Economic Downturn

We are predicting Amazon significantly outpaces competitors if/when there is a downturn in the US economy.

While we are not economists or fortune tellers, there seems a high probability that there will be an economic downturn of some degree at some point in the near future. If the next economic downturn occurs within 2019, we are predicting Amazon will outperform other retailers significantly. With unbeatable low prices, convenience for working families, and an incredibly large catalog of low priced necessities, we expect Amazon to be the go to store when budgets and time are tight.

Amazon Expert Predictions

Liran Hirschkorn
7 Figure Seller
Seller Coach at Amazing Freedom

  1. Amazon merges Seller Central and Vendor Central into a new system called Vendor One, which gives third party sellers more brand control.
  2. Brands direct more ad traffic to Amazon instead of their own websites, increasing PPC costs.
  3. Amazon shares more data and analytics with sellers.
  4. Amazon private label continues to grow, so sellers source in product niches.

Kevin King
7 Figure Seller
Speaker and Amazon Teacher at AMZMarketer.com and FreedomTicket.com

  1. Sellers need to approach Amazon like a real small business, not a get-rich-quick scheme.
  2. Amazon becomes a pay-to-play advertising platform.
  3. Amazon expands their private label brands.
  4. Amazon merges Seller Central and Vendor Central into one system called Vendor One.
  5. Third Party Sellers undergo an approval process through Vendor One, which means sellers must better conform to guidelines.

Danny McMillan
7 Figure Seller
Host of SellerSessions and Founder of PPC Management Tool Databrill.com

  1. Amazon provides a series of tools to battle black hat tactics and thereby attract new sellers.
  2. Other marketplaces continue to fail to compete with Amazon.
  3. Dayparting, geotargeting, and click-fraud technology for PPC is developed to protect third party sellers.

Ed Rosenberg
7 Figure Amazon Seller
Owner of Asgtg.com, Host of ASGTG Event, and Amazon Compliance Specialist

  1. Amazon makes it difficult to open phantom accounts through voice-match recognition or identifying documentation.
  2. eBay emerges as the most potent competitor for Amazon through a series of mergers and acquisitions.
  3. 3P, private label sellers, find more success in the marketplace than Amazon private label brands.

Adi Singh
8 Figure Amazon Seller

  1. Amazon is a lot more involved with initiatives outside the marketplace (influencers, social media, stores).
  2. International markets play a large role in growth for sellers.
  3. Less buying and selling of Amazon businesses.

Dima Kubrak
7 Figure Amazon Seller

  1. Amazon cracks down on hackers and black hat sellers.
  2. Sellers use outside resources to drive traffic to Amazon.
  3. Amazon focuses on pushing exclusive products by giving sellers more control over their listings.

Cherie Yvette
Amazon PPC Manager for 8 Figure Brands
The Urban Cowgirl, Wild West Media

  1. Sellers face fierce competition on category keywords.
  2. Amazon offers more placements for advertising.
  3. Sellers put more resources into remarketing.

Jamie Davidson
Partners with $100m Amazon Sellers
AMZ Insiders

  1. Video becomes more important for product listings.
  2. Amazon places increased emphasis on quality private label brands.
  3. Chatbots become more important for Amazon businesses.

Ryan Moran
Former 8 Figure Seller and Multiple 7 & 8 Figure Exits
Capitalism.com Host

  1. New private label products trend toward micro-brands.
  2. Specific audiences become more important on the marketplace.
  3. Big brands adjust for online marketplaces.

Kevin David
7 Figure Seller
Teaches 10,000’s of Students on Youtube

  1. Accurate data becomes more important for sellers.
  2. Sellers get more creative with keyword research.
  3. Marketing expansion to sources outside of Amazon.

Anthony Bui-Tran
8 Figure Seller
Seller Tradecraft

  1. Amazon makes changes to Brand Registry and PPC to give private label sellers more control over their brands.
  2. New Amazon accounts become harder to open, which means selling Amazon accounts becomes popular on the black market.
  3. Sellers get better access to honest, accurate review generation incentives.

Tom Wang
7 Figure Seller
Trains Hundreds of Amazon Sellers at EcomHub.com

  1. The marketplaces becomes more competitive with an influx of new sellers.
  2. Sellers learn how to drive traffic off of Amazon.
  3. Black hat tactics become less effective.

John Lawson
World Renowned eCommerce Expert
Host at Watchingamazon.com

  1. The China connection is broken, encouraging online sellers to source from other countries.
  2. An economic downturn creates problems for sellers sourcing less expensive products that are frequently bought on impulse.
  3. Amazon continues to dominate market share.

Leo Sgovio
7 Figure Seller & Speaker
Director of Innovation at Viral Launch

  1. Amazon releases their own suite of tools for advertisers.
  2. Influencer marketing becomes a bigger part of the Amazon seller journey.
  3. Amazon attribution and increased external traffic paves the way for a new referral fee structure.

Dr. Ben
7 Figure Seller
Host of Amazon Mastermind thehivemind.co

  1. Amazon rids the marketplace of black hat and inattentive sellers.
  2. New California sales tax issues force Amazon to collect and remit sales tax on all sales going forward.
  3. Google makes a push into ecommerce using Google Express.

Brock Johnson
7 Figure Amazon Sellers
Training hundreds of Amazon sellers at BrockJohnson.com

  1. Amazon platform reaches a point of saturation in the B2C market, so they start to shift their focus toward sellers.
  2. Sellers become more customer-focused, using tools and strategies to create a good buying experience.
  3. Amazon B2B sector continues to grow, creating huge opportunity on Amazon.

Franky Farina
8 Figure Seller on Amazon
Million Dollar Sellers Group  – 9 Figures in Total Sales

  1. Sellers lose access to customer information, as Amazon will keep that data to themselves.
  2. Amazon continues to remove incentives for stocking inventory at their warehouses, encouraging sellers to turn to other 3PL companies.
  3. Tariffs, Amazon private label expansion, and continued reliance on Amazon advertising platforms continue to shrink seller margins.   

Kevin Pasco & Jeremy Sherk
8 Figure Amazon Sellers
Nested Naturals

  1. New private label brands continue to join the Amazon marketplace.
  2. Amazon continues to place restrictions around review generation to maintain marketplace integrity.
  3. Sellers need to have an audience to launch a new product.   

Nick Young
8 Figure Seller
Seller Tradecraft

  1. Amazon establishes long-term dominance on the platform by incentivizing brands to sell new products on the marketplace.
  2. Amazon makes a big push toward social media.
  3. More brands ship direct to Amazon, spelling the beginning of the end for wholesale.

Fernando Cruz
8 Figure Seller
Seller Tradecraft

  1. Sponsored product ads and AMS become significantly more expensive.
  2. Sellers move toward email lists, ManyChat, and social to market their products.
  3. Growing subset of brands that move away from Amazon as a part of their online strategy.   

Brandon Young
7 Figure Seller
Teaching Amazon at Seller Systems

  1. Amazon changes the way they are indexing and ranking products, which means sellers have to be smart about their sourcing decisions.

Conclusion

As you’ve probably noticed, there was plenty of overlap between Viral Launch’s predictions and those of the included industry experts and thought leaders. I’m not sure if it is fair to say that this indicates the prediction is more likely to come true, but it does indicate that there is likely more data pointing to that assumption.

An underlying commonality throughout these predictions was increased competition, focusing on building traffic off of Amazon, and adapting your Amazon success strategies. There is certainly the opportunity to look at this with a negative outlook on the future, but please do not forget that Amazon is continuing to grow it’s ecommerce footprint significantly.

As the opportunity for incredible degrees of success continue to grow, so does the difficulty of achieving that opportunity. Instead of playing the victim to increased competition and “unfair” changes, the truly successful adapt with the times, play the long game, and focus on solutions.

I want to encourage you to focus on the solutions. How will you diversify your Amazon business? What strategies will you use to guarantee you and your team are staying ahead of the lastest success tactics? How can you drive sales, reviews, and keyword ranking in this new landscape?

While there are many components that comprise a winning strategy for the future, Viral Launch is focused on giving you the data, automation, and thought leadership around topics like driving sales, keyword ranking, and product selection. Now, it’s up to you to use these to stay ahead of the curve and continue growing exponentially on the world’s largest marketplace!

Amazon Keyword Search Volume & Relevance Data Change

If you’ve been in the Amazon seller space for any longer than a month or two, you should be no stranger to change. This past weekend was a reminder of how frequent and inescapable this change can be. The most recent change comes in the Amazon keyword search volume and relevance data area.

What change did Amazon make?

Mid-day on Thursday Dec. 13th, Amazon pushed a code change upgrading the technology behind some of their internal APIs. One of the APIs that was recently updated had been feeding a few software providers (including Viral Launch) with exact and broad match search volume, as well as product relevancy data. This change removed these metrics (Amazon keyword search volume and relevance) from the API, leaving software providers without the ability to grab fresh Amazon keyword search volume data directly from Amazon.  

Did Amazon remove these metrics in spite of software providers? While there is no way of knowing for sure, my assumption is that through the process of upgrading this API, Amazon found no need to continue sending these specific metrics, as they were not being shown in any of Amazon’s user interfaces. It seems unlikely Amazon would change the technology behind their APIs simply to remove the data. My guess is that they decided to stop showing any “unnecessary” information through the upgrade process.

What Does This Mean For You, as an Amazon Seller?

While it’s no question that the lack of access to updated search volume is disappointing, the playing field has been leveled as your competitors have also lost access to fresh search volume.

The opportunity now exists to find the new advantage and best solution to identifying and prioritizing your keywords. With change comes opportunity.

The best solution to identifying and prioritizing keywords comes in two forms:

  1. Using software capable of leveraging historical data and sophisticated means of forecasting and estimating
  2. Using PPC and organic performance data to understand how buyers respond to your product.

I think it’s important to note that we will never try to downplay the importance of Amazon keyword search volume on our listing optimization, PPC, and SEO/ranking strategies. With that said, search volume alone has never been the complete answer.

Understanding metrics per keyword – like PPC conversion rate, average selling price and review quantities for top ranking products, etc. – have all played a significant part in our keyword strategies in the past and will continue to in the future. Being able to understand and interpret this data actually becomes that much more important.

How This Impacts Our Tools & How We Can Help You Gain an Advantage

The Viral Launch data science and engineering teams have been working incredibly hard to bring a sophisticated, data-driven solution that is capable of accurate forecasts and providing the transparency you need to logically get behind our new models.

A major focus of this new solution is transparency.  In order for you to trust our new estimates and feel comfortable making informed business decisions, we want to help you understand how we are arriving at our numbers. And it’s this level of transparency that we are integrating into our new solution.

With sales estimates, sellers can validate or invalidate the accuracy of the data by comparing the estimates to their own product’s real sales. But with search volume, there is no absolute way to validate or invalidate the data. When a tool provides a search volume estimate, it is more or less saying, “Hey, trust us… this is good!” I want to shift that ask of trust to, “Hey, here is the process we’re using, and this is why we believe this is the right number.” In essence, don’t trust what we are telling you, trust what we are showing you. Allow us to walk you through it.

The Future of Amazon Keyword Search Volume Estimates

We are beyond excited to share that our current models are forecasting at 75-85% accuracy depending on the keyword. (I’ll talk through our validation strategy here)

At the conclusion of this blog we added a Deep Dive section where we go into the specifics of our new search estimation process. We want to help you understand what we’re doing at a high level to be able to achieve such great results.

One of the major saving graces here is that we have a full year of historical search volume data for many keywords! (We started tracking volume on Dec. 12th 2017 and things closed down on Dec. 13th 2018).

This historical search volume is incredibly important for a couple of reasons:

  1. We will consistently show sellers the historical search volume trend so you can see what the exact volume was at the same time last year. This way you will always be able to use “exact” numbers in your decisions versus our in-house estimates.
  2. It will be the baseline for our search volume estimates moving forward, as typically the best indicator of what will happen in the future is what has happened in the past.

While historical volume is a good indicator of the past, it would be foolish to think that search volume is going to remain the same in 2019. For this reason, we will use other data sources to help us estimate the amount of change in consumer shopping behavior.

One data source that improves our forecasting models is change in estimated sales volume for a keyword’s top ranking products. We are not looking at the number of estimated sales. We are looking at the trend in estimated sales month to month.

For some keywords, Amazon search volume and sales volume are highly correlated, making changes in sales a great indicator of changes in search volume. Here is a simple illustration (not the actual model):

We’ve overlayed the graphs of Amazon search volume for “sprinkler” and estimated sales volume for the same keyword. They trend very similarly throughout the year for the same keyword. In this case, it means we would use Amazon sales behavior as a means of forecasting, while also using our historical data for this keyword.

In other instances,  the trends of Amazon search volume and sales for the top ranking products are not statistically correlated. (basic example, not a statistical model):

We take this same approach for other data sources such as Google search volume trends, etc. Using our massive swath of historical and real-time data, our data science team is capable of using machine learning to programmatically discern which data sources are good and which are bad for each keyword at scale.

The beauty of this approach is it allows us to figure out which data sources are reliable predictors on a per-keyword level, so we never use a data source that would be misleading.

Here is what the new user interface looks like:

As you can see in the image above, transparency is the focus. We show the changes in external factors so you can begin to understand how we arrived at our new estimates. You are also capable of comparing our new estimate with the historical exact volume.

Versus keeping our new search volume algorithm secret, our hope is that this allows you to make the most informed decisions possible by seeing historical data along with how we’ve arrived at our new estimates!

As we continue to identify additional data sources, new statistical/forecasting models, or come up with new and clever ideas, we will continue to improve our search volume estimates with full transparency.

This is a large scale engineering and data science effort, so you will see this change rolling out in our Keyword Manager and Keyword Research tools beginning at the end of next week and propagating over the next few weeks to all words within our database.

The Future of Relevancy Score

We are extremely sad to see this metric go as it had wide-sweeping implications for some of our tools and our ability to help boost sales for our customers. Our short-term plan of action is to show historical relevance score for products we’ve already analyzed, while removing it for those we have not.

While we are sorry we will no longer be able to show you this metric for now, relevancy score is a just a proxy for an even more important metric you will see soon in another tool we have in the works.

Looking Forward

“When you’re finished changing, you’re finished.” – Benjamin Franklin

The longer you have been in the Amazon seller space, the more change you have experienced. When building a business on top of another platform, one of the keys to success is adaptability. The sellers that focus on the opportunity that comes from change, versus those that lament over what was, will have the most success now and in the future. Sadly, I know massive sellers that were devastated by Amazon’s TOS update around reviews in Oct. 2016, where they went from making millions on Amazon to almost nothing within a year because they were unable to adapt. Conversely, I know plenty of sellers that took advantage of the newly evened playing field and have built massive 7-8 figure Amazon businesses since that same review update.

There will be plenty more changes in the future. Your success will be dependent on how well you’re able to leverage your network, team, and resources to turn the new dynamics into a competitive advantage! And we hope we get to help you do that!

Validation Strategy

When building any type of model, whether it’s sales estimates, inventory forecasting, or search volume estimates, you should use 70-80% of the data to train the model. This is what the machine learning model uses to “learn” and then test the new model against the reserved 20-30% data set. This ensures that you are overfitting to data your model has already seen.

In our search volume validation testing, we took a subset of a keyword’s historical data (example: take 9 out of our 12 months of data), used that to train the model and understand correlations in our external factors, and then predicted out the next three months. In those predictions on the next three months, we were ranging between 75-85% accurate!

We’ve been incredibly impressed with the results, and we are confident these new estimates will be critical to your competitive advantage in selling on Amazon in 2019.

WE LOVE FEEDBACK!

We took a bit of risk by being the first to offer a solution; a solution focused on transparency. We’d love to know what you think! Our goal is to help you make the best data-driven decisions possible to have success in your Amazon business. Did we succeed here? Please let us know what you think in the comments!

You will be able to see our new search volume estimates starting next week for increasingly more keywords in our Keyword Research tool and powerful Keyword Manager/Tracker!

——- Deeper Dive ———

Why Not Use PPC Data, Auto-Complete, or Bing Data?

As we brainstormed potential data points that could or would lead to superior estimates moving forward, we considered a significant variety of metrics. We wanted to help you, the seller, understand why we did not use some potentially “obvious” metrics, and why we DID use others.

Why Not Use Amazon PPC Data

Amazon PPC data was one of our first candidates for data points to use in building out our new search volume estimation model. In talking with our R&D team, we realized how these metrics could be quickly misleading.

PPC Impression Data

The idea is simple. If a product’s ad is being shown at the time of search, then it should show (receive an impression) approximately the same number of times as it was searched right? So search volume and ad impressions should be pretty similar right? Hardly.

On mobile devices, a sponsored ad only receives an impression when the ad is loaded. On mobile, generally there is only one ad at the top of the search. After the first sponsored ad, ads are dynamically loaded once the shopper scrolls deep enough into the search results. Meaning, if we don’t have PPC access to the first ranking product for every keyword, then we will miss a significant percentage of impression volume.

On desktop, a sponsored ad receives an impression each time the ad’s page is loaded; however, consistency is the key. In order to get an accurate feel of impressions, we would need to have PPC access for a product running sponsored ads on the first page of each keyword, all day (doesn’t run out of budget), every single day (whole month). One search can also be counted as multiple impressions as users click in and out of listings, sponsored products shown as suggested in detail pages, and add to cart pages, etc.

Having the necessary access to data is a significant challenge. We believe we have the world’s largest set of data next to Amazon, but even we don’t have the necessary data to use search impressions at scale as an accurate indicator of search volume.

PPC Bid Data As An Indication of Volume

We originally tossed around the idea of using suggested PPC bid cost as a proxy for search volume (the more searches, the more people bidding, the more expensive it is). One of the major hurdles here is that suggested CPC can range quite a bit depending on how relevant Amazon deems your product for the keyword. Meaning that Product A with a high relevance may have a suggested bid cost of $.50 per click, while the less relevant Product B may have a suggested CPC of $1.25.

Why Not Use Amazon Auto-Complete

Amazon autocomplete is an ancient technique of using the Amazon search bar suggestions as an indicator of popularity.

The previous thought has always been that the suggested words populate in order of search volume. This would mean that suggested keyword #1 has higher search volume than suggested keyword #2, which has higher volume than suggested keyword #3, and so forth.

As we dove into the suggestions and worked to validate that Amazon was in-fact giving us suggestions in the order of highest searched keywords, we found that was not the case.

While Amazon’s fourth suggestion, which is “fish oil for dogs”, has a search volume of around 9,500 searches per month.

We found countless other examples where Amazon was not suggesting keywords in the exact order.

Disappointing.

Deep Dive Summary

All in all, I hope this helps you understand some of the logic behind why we did not go with some of the seemingly most “obvious” metrics for our Amazon keyword search volume estimation model. Again, transparency is crucial for us during this process!

We have undoubtedly been able to prove that our model is effective and accurate at predicting/forecasting/estimating search volume, leveraging our vast amounts of historical data.

If there is anything that you think we did not consider, or something we may have overlooked, we’d love to hear your thoughts and ideas! Again, our focus is on providing you the best data possible to make smart business decisions.

Now that we have a solution, let’s not focus on what has been, and let’s focus on the incredible opportunities that await us in 2019!

Excited to help you kill it this coming year. 🙂

Let us know what you think in the comments  below and feel free to share this post with any of the larger Amazon community!

Powerful Amazon Keyword Tracker; Notifications, Hourly Tracking, and More

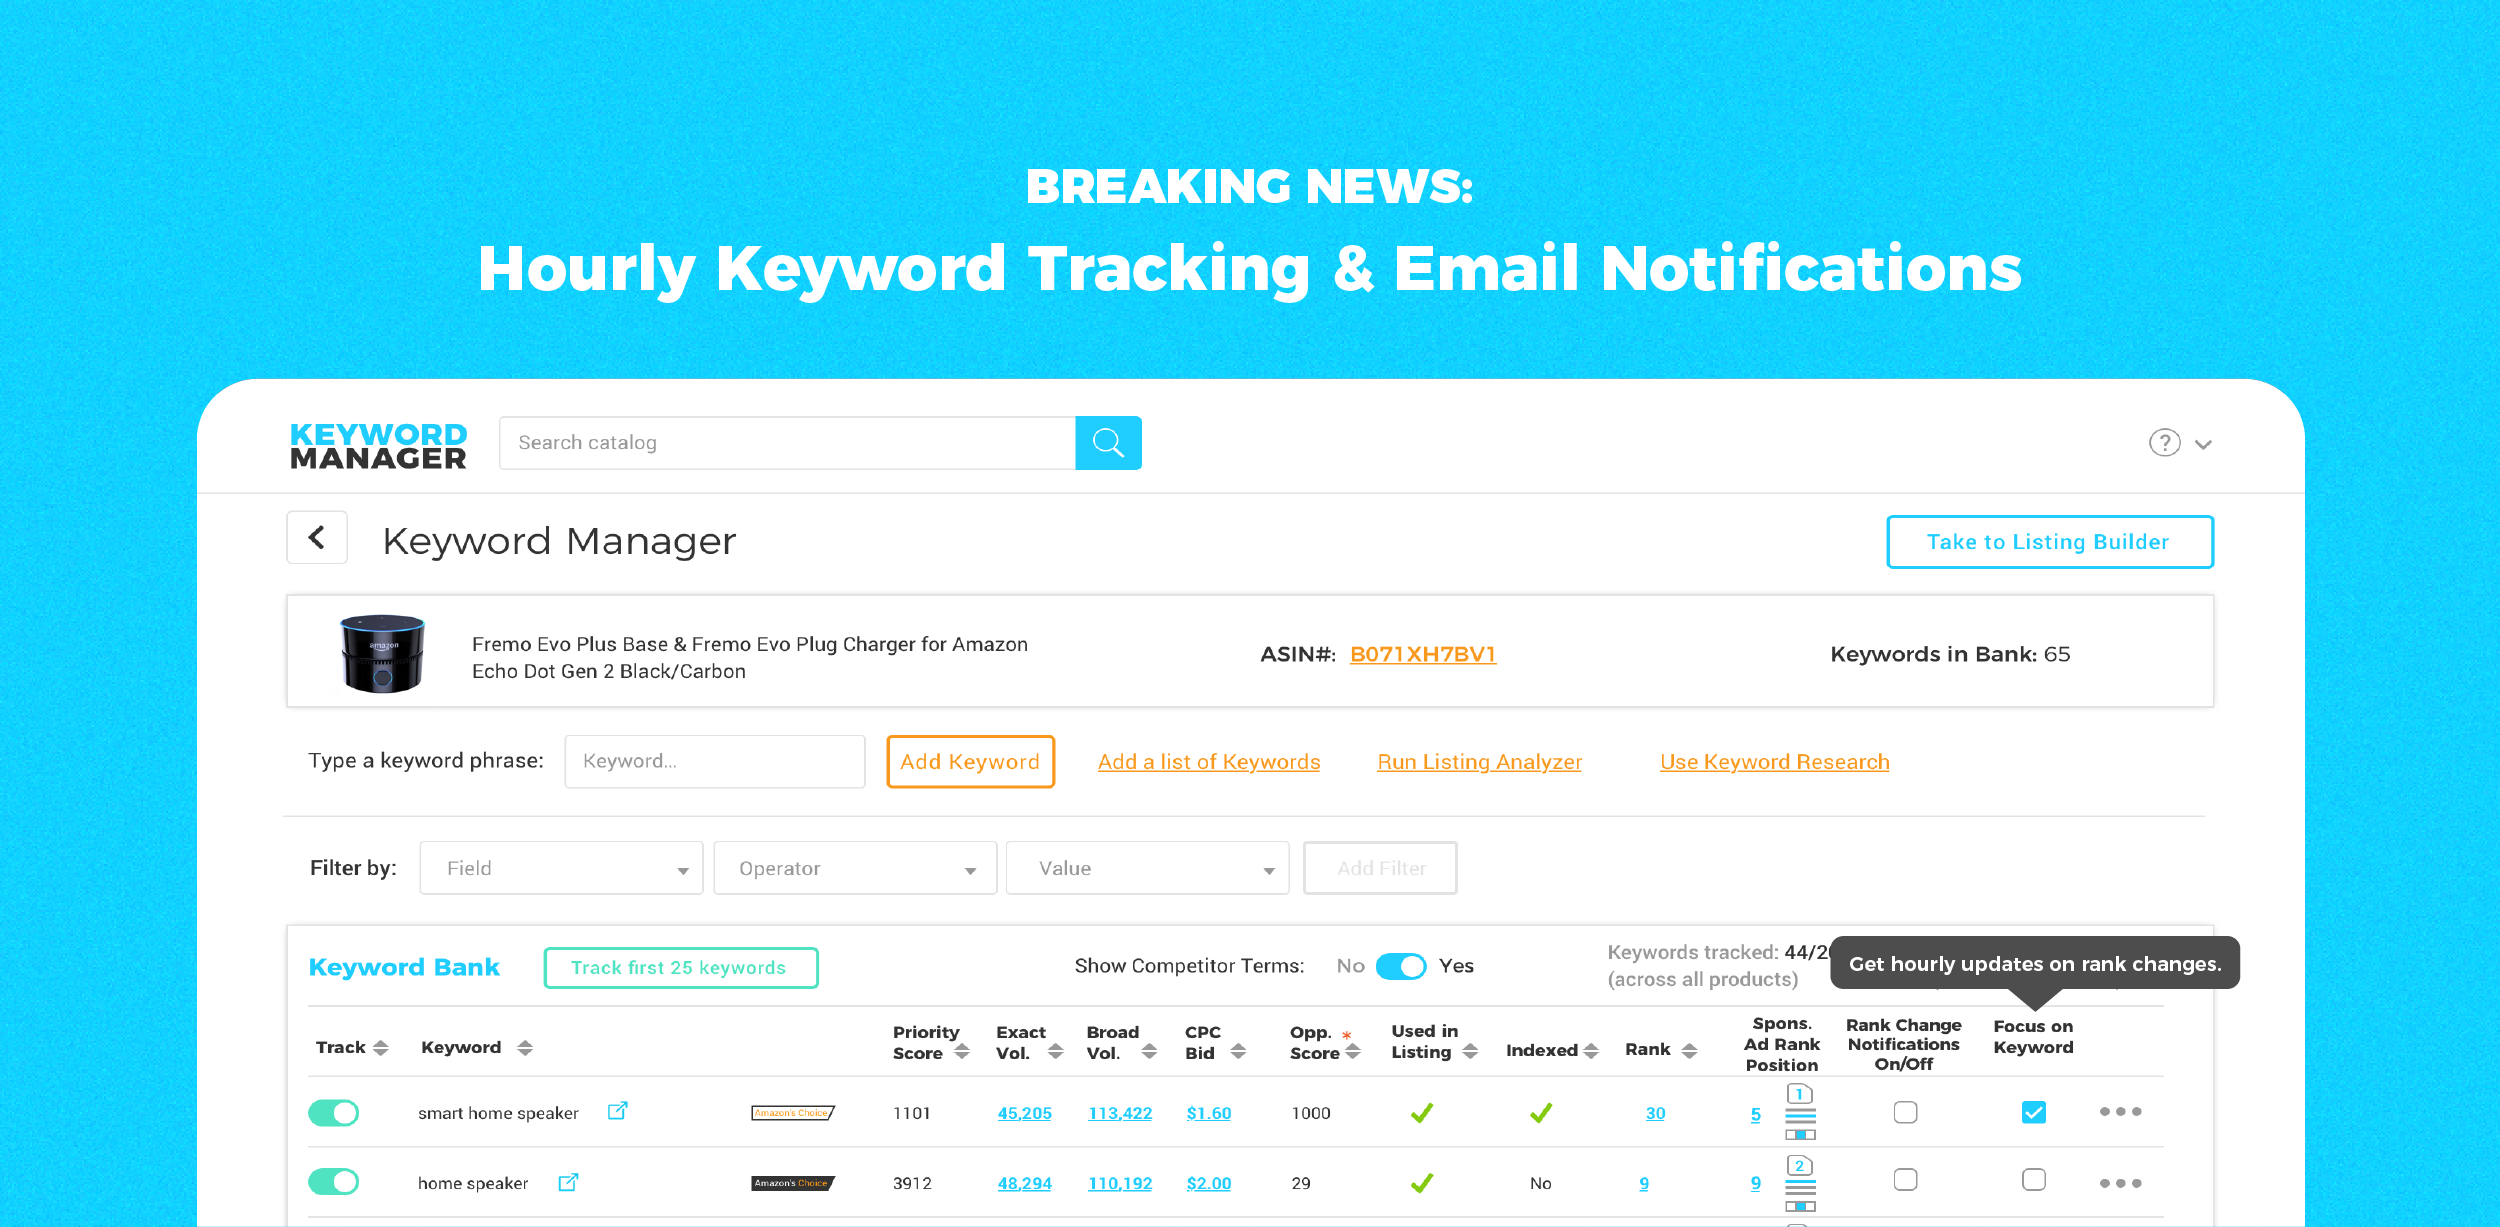
If you have had any degree of success on Amazon, you know how important keywords are. And if you are one of the elite sellers who have made millions on Amazon, then you know keywords are everything! “Everything” is a pretty bold statement, and of course having a great product, an appealing price point, and a significant review quantity are all crucial to success, but all of those would amount to nothing if prospective customers were unable to find your product in the search results. Your Amazon keyword rank tracker is imperative to success in your business.


In this guide, we’ll talk about how you can use Viral Launch’s powerful new keyword tracker and manager to simplify Amazon keyword tracking and stay on top of all of your most crucial metrics in real-time to maximize your Amazon sales. There are six key ways in which our tracker is unlike any others, so that your Amazon sales can be unlike any others.

  1. Sponsored Ads Placement Tracking
  2. Rank Notifications
  3. Hour-by-Hour Amazon Keyword Tracking
  4. Digital Shelf Mapping
  5. Ranking to Sales Correlation
  6. Instant Historical Keyword Tracking

The Viral Launch Amazon Keyword Tracker is a feature within our Keyword Manager tool only available through our Pro package.

Sponsored Ads Placement Tracking

One of the biggest mistakes sellers make when running Amazon Sponsored Product ads is not paying attention to how rank position impacts every single thing. Your ad’s position has an impact on your click through rate, conversion rate, impressions, clicks, cost per click, and ultimately your ACoS (profitability).

To put it simply, ad position significantly impacts the amount of sales you can drive with Sponsored Products and how profitable those ads are.

Uhh….so then why is no one paying attention to ad position?! Let’s just say, we think there is a lot of opportunity for increased sophistication of other Amazon tools. And that is why we are so excited to bring this tracking to you inside Keyword Manager!

For each keyword you decide to track, we will automatically begin showing you where your sponsored ad is positioned, both currently and historically. If your product is not showing at all within sponsored ads, we will show a “-”.

Access to this level of insight for thousands of keywords is extremely powerful for your business! Data is critical to being able to make smart decisions, and we want to make sure you have more access to data around your keywords than you can get anywhere else in the world.


Rank Notifications

Keeping track of where your product is showing up in the search results at just a glance is extremely helpful. But, rankings can change at the drop of a hat. Occasionally, a keyword will fluctuate a position or two throughout the day, but sometimes it can fall dramatically and have a major impact on your revenue. The same is true for your product’s placement within Sponsored Ads, where exact position can be even more volatile.

The whole point of an Amazon keyword tracker is to automate the process of keeping track of where your product is showing in the organic and paid results. But in order to make sure you are going to hit your sales goals for the day, you find yourself logging in multiple times throughout the day to make sure you haven’t dropped in the rankings.

To give you peace of mind and to automate checking your ranking results constantly throughout the day, we’ve built a notification system that automatically tells you when your product’s rank changes in the organic and/or sponsored ad results. Now you can rest assured knowing that your product is maintaining its rank position without even logging in! If there is a change in keyword ranking or ad position, you will receive an email from us letting you know it’s time to take action.

We’ve built our notification system to be extremely flexible, allowing you to fine tune your notification triggers based on:

  • Organic and/or Sponsored Ads
  • Drop or increase in position
  • Number of spots moved (example: drop in at least 3 positions

Hour-by-Hour Amazon Keyword Tracking

Imagine one of your best products is ranking in the top 5 for some of your biggest keywords, and the sales are just pouring in. You check your ranking first thing in the morning to make sure none of your competitors have propelled past you overnight. But then, just hours later, a couple competitors jump ahead of you in the search results, pushing your product out of the top 5. Ouch.

This is critical, and the sooner you know, the sooner you can boost your ranking and take those sales back. If you are only checking your rankings once per day, it’ll be almost an entire day before you notice that you’ve dropped in ranking, meaning a day of lower sales. Keyword Manager allows you to track your most important keywords hourly. Paired with notifications, this allows you to rest easy throughout the day knowing that if there are any significant changes in your keyword ranking for your most important keywords, you’ll know right away.

Being able to track sponsored ad rank position hourly is a game changer when you are focused on maximizing PPC sales. Imagine getting notified within just an hour of a competitor out-bidding you for top ad positions for some of your largest revenue-driving keywords. The beauty of being alerted in near-real-time is that you can take immediate action to control placement and profitability.

Hourly tracking paired with notifications will be your biggest sigh of relief, giving you the confidence that your revenue streams are being monitored constantly. I hope it also gives you plenty of time back in your day so you don’t feel the need to check your keyword ranking constantly. Focus on the big picture for your Amazon business, while we do the tedious monitoring.

*Important to note, that hourly tracking only checks the rankings for the first two pages for each keyword as anything important that happens that quickly, will happen in the first two pages!

Digital Shelf Mapping

In retail, brands pay for specific shelf placement. The better the shelf position, the more shopper’s eyeballs on your product, and the more likely customers are to purchase. But the better the positioning, the more that shelf placement is going to cost. The same is true for sponsored ads.

Where your sponsored ad shows in the search results is critical. For some searches, having the third ad position means your product is showing above the fold on desktop, meaning your product has a better chance of driving more traffic.

For other searches, having the third ad position means you are buried in the middle of the search results, and that results in less eyeballs and lower sales potential.


Knowing exactly where and how your product is being presented to customers is critical to building out your best PPC campaigns. With our Digital Shelf Mapping icons inside Keyword Manager, you can see exactly which of Amazon’s digital shelves your product is on and in which position for each keyword.

In this example, the sponsored ad is currently being shown on Amazon’s first page (denoted by the top icon with the number one), the second row of sponsored results (denoted by the blue middle horizontal bar), and in the first ad position on that row (denoted by the first of three boxes being filled in as blue)

Make sure when managing your sponsored ad campaigns, you know exactly which shelf you are paying for, because as in retail, which digital shelf your product is being displayed on has an impact on your product’s performance!

Ranking to Sales Correlation

At the end of the day, we care about keyword ranking because ranking well in the search results for a specific keyword, should help to improve our bottom line. We wanted to make it incredibly easy for you to identify correlations in sales improvements with increases in keyword ranking (and hopefully never in your case, declines in ranking and drops and sales).

As a quick option to monitoring changes in sales within the context of changes in keyword rankings, we’ve given you the ability to overlay your product’s historical and real-time BSR with your keyword ranking. This will allow you to see just how big of an impact a change in rank has had with a change in your product’s sales!

Organic keyword ranking for this term has trended down, as has the product’s Best Seller Rank (sales)

Instant Historical Keyword Tracking

Automating how you monitor keyword ranking for thousands of keywords across your catalog is an absolute must in today’s hyper-competitive Amazon landscape. Not tracking your organic keyword rank is like not cashing in a lucrative check. If you are still manually doing your Amazon keyword tracking  in an incognito window of Google Chrome, it’s time to reassess your priorities and your ability to scale!

If you already use a keyword tool, it can be hard to switch to a new one with more data and features. One of the worst parts of moving to a new keyword tool is that you usually have to start over completely. You have no historical data, so it takes a while to build up its value. And if there is any significant rank change, you have no idea by how much they have increased or decreased. We understand this pain completely, and we wanted to make sure it was not an issue with our Keyword Manager.

Here at Viral Launch, we view ourselves as a data company. We track everything! So, there is an extremely high chance that we’ve already been tracking your product for your main keywords, and we give you access to that data right off the bat. That means when you begin tracking your products, we’ll show you all the historical rank trend data we have for that product even though you’ve never used our keyword manager before! It’s extremely refreshing to log in and see all that historical data immediately upon entering a keyword into our Amazon keyword tracker.

Conclusion

At Viral Launch, it is our mission to provide you with the software you need to become increasingly successful on Amazon. With access to the world’s most powerful Amazon keyword tracker and digital shelf mapping tool, you’re more prepared than ever to save time and increase revenue. It’s important to mention that, as with any tool, it is only as great you use it. It’s up to you to take action, and there’s no better time like the present! I want to encourage you to go and take action now!

And additionally, while all of the data and automation provided in our Keyword Manager is incredible, knowing how to use and appropriate that data is crucial! Feel free to chat with a member of our customer success team or check out our other available resources to learn more.

Try Keyword Manager for Free

Comment with questions down below! Have you used our tool for Amazon keyword tracking? Any additional feature requests? What do you think of the concept of “digital shelf mapping”?

Viral Launch: An Entrepreneurial Success Story

As a 24 year old with an 8 figure tech startup with over 30 full time employees, I am eternally overwhelmed with gratitude and disbelief at the opportunities I’ve been afforded. Considering the delta between where I (and Viral Launch) sit now and our current trajectory compared to our humble beginnings, I find it hard to believe that anyone could have anything but extreme gratitude and humility, not to mention a deep sense of obligation to be a good steward of all we have been blessed with.

The intention behind sharing this story is three fold:

         1) to elicit inspiration in you, the reader. We all aspire to greatness in some form or another. We all, at some point in our lives, set out to achieve our dreams and leave our positive mark on the world. Many become distracted with life’s comforts or are stifled by fear of failure (and perhaps just as frequently, our primordial being’s fear of success). I hope to show that by sheer perseverance and an open mind to the unknown, you too can see your wildest dreams come to fruition. I believe that entrepreneurs and their companies (including each employee), are the ones creating the greatest impact on the world. I want to do everything in my power to inspire and equip those “born-to-be entrepreneurs” to reach their full potential.

         2) to help illustrate to our customers the principles we have built our company upon; to show the constructs driving our every decision. There is a lot of untruth and shady characters posing as nobility with the intention of making a quick buck in the Amazon seller space. I want to work harder to distance ourselves from these malicious players.

         3) (selfishly) as an expression of thanks. Thanks to the higher power I believe has brought me here (God in this case). Thanks to the friends and family that supported me along the way. Thanks to the amazing team that is the real driving force behind our success. And perhaps immaturely, those that doubted me along my journey. One of my biggest motivators is the doubt of others; especially people in “power” 😉  I love trying to prove people wrong. As is a common theme, the trials and tribulations are the times in which we grow the most. So thank you to those that doubted along the way. To those that made the journey that much more difficult, I thank you for helping fuel my deep desire for growth, improvement, and success.

I think it is very important to stipulate that I, in no way, feel that I have yet “made it”. I want to make sure that the tone of this post is not that of… “I am super successful and have everything figured out so therefore you should listen to what I have to say”. Quite the contrary. By nature, I have a very difficult time with confidence. My mind believes that in every scenario there are infinite possibilities. I think confidence is quite intimidating because it can be so blinding at times. This is not a post of retrospective reflection on my path to “success” because of my “brilliant actions.” This is a post of documentation around the incredible journey I’ve been blessed to find myself on. (To be quite frank, I have a hard time believing that it has been my decisions that have led me here.) This is a post of appreciation around what I have, and further, what I (and Viral Launch) am striving to be, and how you may also be able to find yourself on such an incredible journey.

Three Years Ago Today I Had $50 In My Bank Account

Three years ago today (at 21), I had $50 in my bank account and owed money on my credit card. My younger brother was gone for months for his construction job, which allowed him to pay our rent, our bills, and for our food. My girlfriend at the time (now wife; yeah I’m lucky to have found such a supportive one ;)) was helping to support me by purchasing essentials like deodorant and “swiping” me into her college cafeteria. I had deferred student loans as long as possible and my first payment was lurking on the horizon. Because we couldn’t afford to spend much on our heating bill, it was freezing in our apartment and my hands were so cold that I was unable to type. I resorted to cutting holes in some old athletic socks so my fingers could poke through. I called them my “hacker gloves” and they actually worked surprisingly well. I couldn’t look to my parents to help me out either. Just a month prior, my mom had her car repossessed and was evicted from her house (not so uncommon for us growing up). My dad was going through a rough second divorce. I was coding 16+ hours a day building the original Viral Launch platform wearing my winter coat in candle light (for both light and warmth) with my hacker gloves in our little apartment in the humble town of Marion, Indiana. And this, ladies and gentlemen, is the origin of Viral Launch.

This day is so important to me because on December 18, 2014, I convinced my then co-founder to allow us to pay ourselves from the revenue we had generated for the first time.

That first $600 payout felt like $10,000!!! 🤑

A Quick Backstory

I’d like to first provide some context as to how my brother and I arrived in Indiana, how I found myself, a college dropout, coding with socks on my hands, and how the concept for Viral Launch came about.

While studying business and running track at a small Christian college in Indiana, I taught myself how to code at night. Midway through the second semester of my junior year I was developing demo iOS apps around a new technology called iBeacon. As a quick aside about me, I love learning! I try to read everything! In my business classes, my professors were teaching principles that contradicted what the Fortune 500 executives were preaching in my readings. I felt the things my professors were teaching had lost relevance in the fast moving techno-business environment we all find ourselves in. I felt like class and track were getting in my way of my learning and my ability to push the boundaries of iBeacon technology and application. I had also developed extreme guilt around running track. I felt like I was working so hard only to benefit myself while there were so many out there that I could help if I spent the same amount of time and effort enabling them somehow. For those reasons I dropped out with no plan other than to keep chasing my dreams, diving further into learning, and building great tech!

I moved back to Jackson, Michigan, the small classic midwestern town where I grew up, for a few months. It was at this time that my brother, Corey, and I decided to move back to Indiana on money he had saved delivering pizzas. He needed to leave Jackson to get out of trouble, and I wanted to be in the same town in which I had gone to college. We were just a couple of brothers carrying each other through life as we had throughout our rough upbringing. 😍 💪

How Viral Launch Came To Be

So the unsexy truth about how Viral Launch came to be is that there was no awe-inspiring lightbulb moment where the idea struck me out of an insatiable need for my own service. No  “scratch your own itch” story that so many great companies have been founded upon. The truth is that it wasn’t my idea at all. I hardly even understood the fact that what you purchased on Amazon largely isn’t produced by Amazon at all. To this day, I’ve still never even sold anything on Amazon.

A former trackmate of mine, Jordan, was selling on Amazon and was making great money after just a month or two of being live on Amazon.com. It was this trackmate and friend that had the brilliant idea behind Viral Launch. Fortunately for me, he knew about my love for tech and had always wanted to start a business with me. Despite my lack of initial interest, Jordan continued to push the idea. He mentioned the possibility of making $10,000 per month with little effort. He promised to handle the Amazon side, while I built the platform. I saw this as a great opportunity for me to make money while I continued to focus on my iBeacon business.

So with Jordan taking 60% of Viral Launch, and I 40%, we set off.

Naturally, I default to a work ethic turned to insane mode. While Jordan (my co-founder) was having fun running track and hanging out with friends, I inequitably, and almost as a precursor to the next three years, spent every waking moment pushing to improve Viral Launch for our customers. Out of his good will, Jordan decided we should be equal in equity and moved me up to 50%. 🙂

From Passionless to Changing Lives

Around 8 months into Viral Launch, I had essentially taken full control over the business (although not yet, technically).  As is common for me, I began feeling as though I were only running Viral Launch for my own benefit. The money was great, but I felt like I was only helping those with money make more money. Money and wealth is not of much interest to me. I view my life’s purpose as needing to help enable those that haven’t had the amazing opportunities I’ve had. I would much rather help those unable to help themselves: the disadvantaged, than those trying to make smart investment decisions with their excess cash.

So for a month or two I planned on bringing in someone that could run Viral Launch while I worked on my next project that would be focused on the underprivileged. I also felt it was impossible for a non-internet marketer to have success in a market where marketing far out trumps great product. (I’m a tech/product guy, not at all an internet marketer).  

It was at this time, however, that a few of the entrepreneurs Viral Launch helped had incredible success stories they shared with me. This had a significant impact on my mindset and the amount of gratitude I had for the position I had now found myself in.

Here are a few of the stories that curiously all came in in the span of a couple of weeks:

  • A dad whose young son had just been diagnosed with a mental illness had sold his truck to start an Amazon private label business in hopes that he would be able to quit his job to spend more time with his son. Viral Launch was able to give his business the tools and guidance needed to achieve success.   
  • An entrepreneur had taken some loans out to try to get their Amazon business off the ground. After things hadn’t gone as well as he had hoped, he quickly found himself and his family in financial trouble. Thanks to the Viral Launch platform, he was able to make enough money to pay off his loans and continue to build his business. He couldn’t thank me enough.
  • A husband and wife had sought to be entrepreneurs for years, however, nothing seemed to click. No matter how hard they tried or how many resources they poured into the business, success remained so distant. After a few months of working together, they had really hit their stride and were making over $10,000 a month in profit. More importantly, they had finally proven to their friends, family, and themselves that they too could be successful entrepreneurs.

I realized that Viral Launch was helping entrepreneurs of all kinds achieve their dreams, and how fortunate I was to get to be even a small part of that. Some of our clients were using portions of their profits to give to charitable causes. By extrapolation, I began to see that Viral Launch had become an incredible opportunity to have an amazing impact on the world. It may just have not been as direct as I had originally envisioned.

It was also at this time I realized how much I had learned in the last 8-12 months. I’m so passionate about learning. One, because I just enjoy it. And two, because I know that each bit of information I obtain improves my overall perspective, making me that much more capable of helping the next person. I had learned an insane amount by running everything myself initially –  from building a scalable tech platform, to managing tens of thousands of customers (from our coupon base), to navigating traditional business principles.

All of the sudden I had realized what an incredible opportunity God had provided out of a reluctant decision to make some money on the side.

After a year into our existence, I pushed my co-founder to sell his half of the business to me. Out of a desire to continue running track and enjoying college, as well as to give Viral Launch what it needed (a dedicated leadership), he agreed to the buyout!

I found myself the sole owner of a growing tech company, learning a tremendous amount each day and having a significant impact in the lives of entrepreneurs. I was humbled. I was in awe. And I was completely filled with gratitude.

This is when I knew that I had to push Viral Launch as far as I could. I’m obligated to.

If you knew that every moment you spent working on your business you would impact an exponential number of lives, how could you possibly concede doing anything but?

This is the mindset I find myself in every day and it’s the force driving my unending energy and excitement around what we are doing here at Viral Launch! I hold this fact with insistent gravity and magnitude.  

The Launchpad to Success

Our company’s mission, our “why”, is to be the launchpad to success for our clients and our employees. (If you haven’t seen Simon Sinek’s video on “why”, I highly suggest it. It’s part of our onboarding).  

One of the vital characteristics required to join the Viral Launch team is compassion for people. You must genuinely care about helping people to be a member of the team. This allows us to create a team that is driven not financially, but by the impact we have on the lives of our customers.

It’s this mission that dictates our product roadmap and how we prioritize the order in which we build those tools/services. While there are plenty of software “tools” we could build that would be great additional revenue boosters, we are focused on solving the most impactful issues our customers face throughout their Amazon seller journey.

Each week at our all-team meeting, I select a topic for the team to focus on for the week, whether that be ingenuity, discipline, efficiency, etc. I then get to tie that topic into our “why” and how our customers are depending on us to engender “topic XYZ” to impact their lives. It’s always motivating and a great reminder for why we’ve decided to show up to the office so early on a Monday morning.

One positive externality is that it also creates a fantastic work environment devoid of egos (although I guess if you are going to work for a 24 year old whose only real job was at McDonald’s while in high school, there is little room for ego anyways lol).

The Journey Is Rough But It Makes Us Who We Are..Enjoy It

So how did we get to be a 30+ person company (we’re currently hiring ~10 positions if you’re interested 😉 ), helping tens of thousands of Amazon sellers along their journey to success – all without raising venture capital or taking on an ounce of debt?

Hard Work

One of my biggest blessings is my work ethic. This helped me have success in athletics in high school and college, and has been amplified in business.

For the last three years, no matter how many people we have on the Viral Launch team, I consistently put in insane hours. (So much so that in our early days, I rarely ate and developed a chronic stomach sickness that causes me to randomly get sick throughout the day and when I exercise if I don’t take medication.)

As a blueprint for “work hard” for those wondering…

  • 6:30 am Wake up and head to the gym
  • 8 am Head to the office
  • 6:30 pm Head home
  • 7-8 pm Dinner with my wife
  • 8:30 pm Back on my laptop for work
  • 12:30-2:30 am Head to bed (depending on that night’s project..)
  • Friday and Saturday night – reserved for time with my wife.
  • Saturday – I sleep in, head to the gym then to a coffee shop to work
  • Sunday – church in the morning, then work!

Every week roughly follows this plan, although there’s been plenty of occasions where “Head to bed” doesn’t quite happen. (And I’m still not 100% on waking up every morning. When I’m up super late it makes it a bit difficult to wake up for the gym 😉 )

A lot of people become concerned about “burn out”. 1) I generally think people like to make excuses for themselves which I work hard to avoid, and 2) thankfully, I’m so passionate about what we’re doing at Viral Launch and so full of gratitude that I rarely get the feeling of “burn out.”

Sheer Perseverance

By consistently putting one foot in front of the other, no matter how difficult it is to take that next step.

In our early days, attending conferences was rough. I get it. I was a 22-23 year-old talking about a “startup” few had ever heard of, let alone used. People would closely relate us to other services in our space although our value proposition was quite different. Rejection was common but I continued to show up and build relationships.

Especially in our early days, we were by far the underdog. However, day in and day out we provided better customer service, better results, a better overall experience, and at a better price. For two years we fought to take market share bit by bit.

Now we own the majority of the market share 🙂

Throughout the last few years, we’ve had plenty of betrayal from industry “friends,” competitors slandering our name, scammers ripping off our website, bad investments (you would not believe the amount of money you “burn” when you like trying “everything” lol), poor hiring decisions, sleepless nights trying to hit deadlines, missed deadlines, and so much more! It’s a roller coaster of emotions to say the least.

You will encounter so many hurdles, even in the span of a week, let alone your life. It’s your determination to continue to execute and put one foot in front of the other, no matter the circumstances, that will allow you to reach success.

Focusing on Thinking Long-Term

I think the major plague of the Millennial generation is not that of a lack of work ethic, but a lack of long-term vision.

Scarcely do people really take the time to step back and align their short-term decisions with their long-term ambitions. Few sit down and chart out their path to success. Most make their decisions off the cuff which leads to short-sighted money chasing that ultimately leads to little long-term gain.

A story of long-term thinking triumphing over the short-term brings us to a conference in early 2016. I participated on a panel with the CEOs of a few highly revered services in the Amazon seller community. I found myself at odds with the three other CEOs on the main topic. Essentially, I felt they had built their companies on a short-term strategy. They obviously thought I was wrong and made that known to the audience of at least two hundred people. At the time, I was a lot less confident in my own knowledge and beliefs, let alone my ability to convince the room of my position. I walked out of the room feeling defeated and disappointed in my self-confidence. However, I was unwavered in my overall position on the topic of ABC being a transient / short-term strategy. Despite the allure of the opportunity for quick money by going down the short-term path, Viral Launch remained focused on the long-term and around 8 months later, we were proven correct. Amazon made a major systemic change completely wiping that short-term strategy out of the realm of possibility. Overnight, two of those three companies had to lay off many employees, one of which had to close their doors completely for a few months, later to return as a near replica of Viral Launch. Meanwhile, the day after Amazon’s major update, Viral Launch experienced a record for largest single day of new customer growth.

Had we fallen into the same trap of chasing the quick money with disregard for the long-term, we likely would have fallen to the same fate.

This is just one such example of how playing to the long-term has been a major contributor to our growth. We see the compounding effects of our strategy play out each day and will continue to be one of our greatest competitive advantages among our competitors.

I cannot encourage you enough to delay gratification for the long-term glory. Rome/Amazon/Apple/etc. wasn’t built in a day, and nor will your dreams.

Enjoy the journey and focus on the end goal.

By Being True To Ourselves

I think we generally all set out with the intentions of achieving something great, however, if you’re not careful and extremely intentional about remaining true to your mission, it’s easy to lose yourself chasing after money.

I once heard a saying that, “the devil works in the margins.” I think this is generally spot on. It’s the “slippery slope” situations where a seemingly inconsequential omission or deception transcends overtime into cheating thousands out of their money and their dreams for your own gain. I’ve seen this time and time again among the “leaders” in our industry.

A simple and common example in our industry is misinformation around success tactics. Imagine an industry “guru” lays out how they made “millions of dollars selling on Amazon.” They include a walkthrough detailing how they achieved success, including using their own service. However, the “guru” leaves out a few of the key details because they don’t want all of their secrets to get out or because a few of those details would lead to the audience using a competitor’s service.  From the “guru’s” perspective, it doesn’t seem like a big deal to leave out a couple of details; they did after all tell their audience nearly everything they need to know about how to “make millions of dollars”. They just left out a few small details so their competition doesn’t get more traffic. What they don’t realize is that a big portion of their audience is going to replicate the process and expect similar results. When they don’t achieve those same results, they are going to think they are doing something wrong rather than the “guru” having shared bad information. So what we see happening is the trusting follower tirelessly tries to make the tactic work that has supposedly worked for so many others. In some scenarios, the seller only has so many available resources to get their business off the ground. If attempts one, two, and three don’t work, they have to close up shop and go back to their day job.

We’ve seen similar situations happen countless times, where in our world, everyone wants to be a “guru” but has little qualification or integrity to be such. We have also seen hundreds of businesses fail because they’ve built their businesses off of the empty words of industry leaders, too focused on self-gain to care about the consequences of their words and actions.

It is actually quite an intimidating concept when you accept it. It’s so easy to make a small decision for your own gain at the expense of another. The scary part is that it can so quickly snowball into something that wreaks far greater havoc.

Unfortunately, there are becoming fewer and fewer folks in the Amazon seller community I would be proud of being associated with, and I imagine a similar situation can be found across the business world as a whole. So many lose themselves chasing after growth and money that they become blind to the trail of shattered dreams and failed businesses they’ve left in their wake.

Fortunately for us as a company, we are more driven by our impact on others than we are by money. This has allowed us to run from the margin and stay true to our core mission, to be the launchpad to success for our clients!

In any situation, it is not as simple as choosing the moral versus immoral decision. Any decision with even a hint of non-morality, you need to run as far from as possible. Be the opposite of the market. Be overly moral.  

The key is to never venture into the margin.

Being Intentional and Saying No Often: AKA Opportunity Cost

As entrepreneurs we see endless opportunity in the world. Now that I have the brilliant,  ambitious team that I do, they also see tons of opportunities. I generally see it as my job to turn down the majority of the exciting ideas, that are usually great, but would distract us from our overall long-term mission.

There are so many things you could do, but only a few you should do.

The trick is to say “no” often so you can focus on the big ticket projects. The projects that will really define you and your company.

Daily, my Director of Product and I have to make opportunity cost calculations around which features to include/add to any one of the tools we have running or in the works today. A feature could be “really cool” but may take two days of development time. A day may not sound like a long time, but when you add up 10 “really cool” features, you find yourself a whole work month (there are generally 21 work days in a month) away from your next “great” project.

I cannot emphasize enough how important an understanding of opportunity cost is when you are an entrepreneur (and likely for non-entrepreneurs, but I have only ever been an entrepreneur, so therefore do not know how important opportunity cost may be to you lol).

I also think it is extremely important to be intentional about those you spend your time with and those you associate yourself with. This impacts your reputation, your perspective on the ecosystem you are working to have an impact on, and so much more. The wrong influence can lead to poor decisions and lost opportunity.

Conclusion

Success is relative. Success, to you, likely means something different than it does to me. And it’s “success” that I hope to have inspired you towards; no matter how small the change.

To me, success is about giving every ounce of energy towards having a positive impact on the lives of others and learning along the way so I can help even more tomorrow.

Somehow, through all of the above events and decisions (and insane amount of blessing/luck/whatever you call God), I’ve found myself on a successful journey, and my hope is that by reading about mine and Viral Launch’s story, you’ll be that much more inspired to find your own path to success.

Just remember to enjoy the journey. To fight through failure and adversity as it only makes you stronger and wiser. To make decisions for the long-term. To focus on others. And to work insanely hard for what you’re passionate about every waking moment.

The payoff is more fulfilling and rewarding than you can ever imagine.

Thank you for reading, and thank you if you are one of the many that have made this journey possible. 🙂

I wish you all the best!

(Interesting? If you know me at all, I THRIVE off of feedback. Would love to hear your thoughts in the comments or however else you want to get it to me. I’d really appreciate it! 🙂 )

The First of the FBA Amazon Seller Tools Available On the Alexa

0Introducing the very first Amazon Seller Tool on Alexa: Market Intelligence.

As an Amazon FBA seller, you’re constantly thinking about what your next great product is going to be. The majority of your best product ideas don’t hit you when you’re sitting in front of your computer ready to validate it with any of the available Amazon seller tools. So for all of those times you get that “next big idea” while you are, say, washing the dishes, taking a shower, or whenever private label brilliance strikes you, and you are without a killer research tool at your disposal, problem solved:


Enabling Market Intelligence On Your Amazon Echo Device

To enable this Amazon seller tool on your Alexa compatible device,  simply head to the Alexa Skills Store (or use the Alexa app), search “Market Intelligence”, click into the skill with the title “Viral Launch – Market Intelligence”, and press Enable.

How To Do Product Research Hands Free

  1. Make sure Market Intelligence is enabled on your Echo device.
  2. Say to Alexa: “Alexa, open Market Intelligence.” (Alexa will respond: “Astronaut online”).
  3. Say: “Search [insert product/keyword here].” (Alexa response: “We are go for [[product/keyword]]”).
  4. Alexa will now begin counting down from 10. This gives our systems time to grab all of the necessary market data and run our proprietary analysis.
  5. If our system was quick enough, immediately after saying “one“, Alexa will tell you the star rating of the product as well as any tips, warnings, and alerts.
  6. If the system was not quick enough, you will need to say “blast off“, at which point Alexa will give you the searched product’s star rating as well as any tips, warnings, and alerts associated with your search.


The Next Breakthrough In Amazon Seller Tools?

No, we don’t expect the next wave of FBA tools to start emerging on your Echo device. We just thought this would be a fun way to use and share our killer product research tool, Market Intelligence!

All in all, even if you just use the Alexa skill once, we hope you enjoy and have fun with it!

What do you think?!

Amazon Product Data: How to Interpret & Analyze

“Amazon Product Data: How to Interpret & Analyze” is an excerpt from Viral Launch’s Ultimate Guide to Sourcing Private Label Gold Mines ebook. Download the full ebook at the bottom of this post.

Interpreting and Analyzing Amazon Product Data

Sourcing tools provide A LOT of information! Having more data, assuming it is accurate and relevant, is always going to help sellers make better sourcing decisions as they research products on Amazon. However, that is assuming those sellers know how to interpret and leverage that information to inform their decisions. Here we will do our best to highlight all of the available data, what it means, and how it should influence your sourcing behavior.

Doing Amazon product research using Market Intelligence begins when you run a search for the product you have in mind. We highly recommend that you search the product’s most relevant yet basic term. For example, if you are searching for a vitamin c serum, don’t search “Vitamin C,” which is too broad, or “Vitamin C Serum for Women,” which is too specific. Simply search for “Vitamin C Serum.”

Identify what customers are purchasing for this search term

Knowing what is selling for a search term and/or product market is crucial. Imagine you wanted to sell some gloves to cover your hands while grilling, and you had a product like this in mind:

Well, when you search “grill gloves” or “grilling gloves”, you’ll find that more customers are actually looking for a five finger glove made of either silicone or another heat resistant material.

Sourcing the wrong type of widget for the search term you’re researching can have major implications. Sure, you can still sell the widget with different positioning that is more relevant to what is actually selling (in this case you would need to position your “grilling gloves” as oven mitts), but the market landscape for oven mitts may be completely different than for grill gloves.

You may have to sell at a completely different price point in a market that could be far more competitive. We’ve seen instances, much worse than this example, of sellers not knowing what is already selling when trying to enter a market. Most of the time, it ends with a much lower ROI than anticipated.

In conclusion, know the proper positioning of your widget, and sell a product that is very similar to what the market is already purchasing.

Identify Outliers

When it comes to analyzing a market, you may come across a listing that has abnormally high or low sales and/or reviews. Generally, in your market considerations, we suggest dismissing those listings as outliers. In our experience, these listings are not worth taking into account when performing your analysis as they are not representative of the market or what you should expect for your product. As you can see in the image above, the highlighted row has an astronomically high number of sales relative to those listings around it. Market Intelligence will automatically flag those outliers for you when you display Amazon product data in the Filtered View.

Product Category

When it comes to Amazon product data, knowing the product category is crucial for estimating sales. Sales are estimated based on a product’s Best Seller Rank within its respective top-level category (ex. Home & Kitchen). Knowing the product’s category may also help you understand how other sellers are positioning the product. Finally, you’ll want to make sure that you know the requirements for certain categories and products requiring approval. Sourcing a product in a gated category without proper preparation will set you up for a headache down the road.

BSR (Amazon’s Best Sellers Rank)

What is it?

The Amazon Best Sellers Rank is a metric of a product’s sales relative to the rest of the market within a particular category. The top selling beauty product would have a BSR of 1. The second best seller would have a BSR of 2. This is very important for sourcing. Amazon product research tools use this metric to estimate a product’s sales by leveraging a proprietary algorithm that translates BSR to estimated sales. Market Intelligence shows a sparkline of BSR over the last 30 days to help give a quick view of how sales have trended for that product over the last 30 days.

Clicking into the BSR 30 sparkline will present a popup that shows how the Best Seller Rank has trended over the last 3-4 months for the product.

Source Smarter

Looking at how BSR has trended for a particular product can help explain certain scenarios. For example, a sudden drop in BSR could indicate a promotional giveaway. In combination with the price trends, you may be able to explain fluctuations in BSR with fluctuations in price.

Monthly Revenue

What is it?

The purpose of this metric is pretty obvious. Monthly revenue is calculated simply by multiplying the monthly sales metric by the current price point. Knowing what other sellers are grossing in the market is important for knowing what the top line revenue potential is for the market.

Source Smarter

We strongly suggest not basing your expected sales on what the top 1 or 2 sellers in the market are selling. This suggestion goes back to not basing your expected results on any particular ASIN. We suggest taking an average monthly revenue from a few of the listings you feel confident you could compete with on ranking position, price, reviews, etc.

For example, I would expect to start-off selling around $10k/month in gross revenue based on this screenshot versus the $100k+ the top two sellers are selling at because they have very high review quantities.

Underestimating monthly revenue will do you much better than overestimating when calculating sales projections. It’s great to be optimistic, but this is an area where practicality will serve you well.

Price

Price is an important metric for informing your sourcing decision in two ways: 1) If you have a revenue/profit goal in mind, knowing how much you can charge per unit will help you know how many units you will need to sell each month. 2) Price will allow you to determine your product’s unit margin.

While some markets are more price sensitive than others, price can be a major lever in increasing/decreasing traffic, but can also have a major impact on profitability. We’ve seen so many sellers source “higher quality” products which forces them to charge much more than the average market price. There is certainly a time, place, and strategy for doing this. However, from our observations, this tends to end up being a mistake, and the product struggles to match projected sales volume.

Source Smarter

Make sure you can match the average market price with plenty of margin!

Unit Margin

What is it?

Unit Margin is the amount of money Amazon will pay out for each product purchased (considering no returns and promotions). The unit margin takes into account Amazon’s marketplace referral fee (Amazon’s fee for selling on their platform), the short term inventory storage fee (charged based on the product’s dimensions), Amazon FBA order handling fee (calculated based on the product’s weight and dimensions). You also have the option to input your landed unit cost to get an accurate representation of associated variable costs. The bottom line “Margin” figure offers a glimpse into what you can expect to be paid out by Amazon per unit. Tip: Changing the landed unit cost for one product will apply the landed unit cost to all products shown in the “Top Sellers View” for your convenience.

Source Smarter

Pay close attention to this field. For example, having the potential to drive top line revenue of $100k per month is fantastic, but let’s say the unit margin is close to $0, then that $100k top line figure is worthless as it won’t actually contribute to your bottom line. Another factor to be cognizant of is that the margin across markets can decline over time. If you find a market and product that allows you to have a comfortable margin, you will essentially have insurance for a profitable future.

Monthly Sales

What Is It?

Estimated monthly sales is an estimation of the number of orders a product has had over the last 30 days. Based on an enormous amount of aggregated market data, both historical and current, we’ve created a custom sales estimation algorithm that is updated and improved nightly. By observing a product’s Amazon Best Sellers Rank within a top level category, we are able to estimate the number of orders a product has seen. Part of our superior accuracy is our Composite Estimate. Looking at historical data, we provide estimated sales volume per day for the last three to four months.

Source Smarter

Knowing how other sellers in the market are performing is critical to identifying the sales potential. Sales volume is the largest indicator for success in a market. Products with high sales volume are performing well, those with low sales volume are not performing well. Estimated sales act as an indicator for many scenarios:

Product Type: By being able to observe how each individual ASIN is performing in estimated sales volume, allows you to identify which types of products are performing well. For example, looking at a Fish Oil, observing which pill counts have higher estimated sales will help inform you which pill counts you should consider sourcing and which you should avoid.

Sales Potential: Let’s say the top 10 sellers are driving less than 100 estimated sales per month, is this a market worth getting into? Yeah, maybe if each unit is selling at $100 per unit ($100 * 100 = $10,000), but if you can only charge $20 per unit with a top line revenue of only $2,000 it’s likely not worth getting into.

Inversely, let’s say that the top 20 sellers are averaging over 1,000 sales per month (excluding other factors). That means there is high potential and considering other factors, this could be a great product to get into so long as you can cashflow the inventory.

Review Quantity

What Is It?

Review quantity is one of the largest barriers to entry for a market. You must definitely pay attention to the review quantities of top performers. We’ve observed plenty of instances in which sellers enter a market due to high sales potential, but do not take into account the significance of the competition, and struggle to ever hit that sales potential.

Source Smarter

Pay close attention to how review quantity impacts sales.

Do all top sellers have a high relative review quantity? If so, this is an indicator that you will need a comparative number of reviews in order to sell at the same volume.

Are there plenty of ASINs with low relative review quantity that are selling at a high volume? If so, you may have the opportunity to sell at a decent volume with a low review quantity. This is generally a great thing, but you want to be careful to know this definitively.

Are there only one or two ASINs that are selling well with a low relative review quantity? A warning to the wise, we would identify those listings as outliers, and would suggest not taking their performance into account. If you want help identifying outliers, we suggest clicking on the “Filtered View” where we attempt to programmatically identify outliers for you.

Average Rating

What Is It?

This metric displays the average review rating for a product.

Source Smarter

While it is important to source a high quality product, knowing how other products are performing is an opportunity to know how your product needs to perform in order to stay competitive. For example, finding a product market with a low average review quantity (ex. Market average of 3.5 stars) could be an opportunity to source a higher quality product that customers are going to be satisfied with.

The savvy sellers will be sure to click in and read the reviews of many products in the market to learn what customers do/don’t like about current offerings as well as potential deficits and opportunities to provide a better experience. With that said, be mindful that your product updates/alterations do not cost too much on a per unit basis so as to drastically diminish your unit margins.

Who Owns the Buy Box

What Is It?

Here we denote what fulfillment method is being used, or identify if the product is shipped and sold by Amazon.

Source Smarter?

At the time of writing this piece, we feel that this metric should not have much of an impact in sourcing decisions. There are benefits to knowing what the competition is doing, for example, if many listings are fulfilling via FBM, are not Prime eligible, and economically it makes sense for you to fulfill via FBA, this may be an opportunity as shoppers and keyword ranking favor Prime eligible listings. There are also some concerns with trying to enter markets that are dominated by products sold by Amazon directly. These ASINs typically perform well and can be a bit more difficult to compete with.

Sales to Reviews Ratio

What Is It?

This is a simple ratio calculation of estimated monthly sales divided by current review quantity. We call this the “ROI Ratio”. We explain the importance of this metric later in extensive detail.

Net Profit

What Is It?

The Net Profit is an estimation of the payout the product produced over the last 30 days based on the calculation of estimated sales multiplied by the unit margin. (ex. $5.50 per unit *100 units sold = $550)

Get the Complete Guide

Did you enjoy learning about Amazon Product Data and how to interpret and analyze it effectively? To get other golden nuggets on sourcing your next home run, download the Ultimate Guide to Sourcing Private Label Gold Mines.

Contents include:

  • Crucial concepts
  • Amazon Product data vs. market data
  • Interpreting and analyzing market data
  • The key metric to ROI
  • Plotting your course for success

And more…

Fill out the form below to receive the guide and start sourcing gold mines:

Amazon Product Research: Interpreting and Analyzing Market Data

Related:

The ROI Metric: Identify the Best Products to Sell on Amazon

Generate Amazon Product Ideas: 3 Creative Methods for Sellers

Amazon ROI Metric: Identify the Best Products to Sell

“The ROI Metric: Identify the Best Products to Sell on Amazon” is an excerpt from Viral Launch’s Ultimate Guide to Sourcing Private Label Gold Mines ebook. Download the full ebook at the bottom of this post.

The Key Metric to Amazon ROI: ROI Ratio

Finding the best products to sell on Amazon includes identifying and sourcing high ROI product markets.

Generally, the largest barrier to achieving sales potential in a given market is relative review quantity. We have overwhelming data showing us the relation of organic sales to relative review quantity. For example, let’s say that the majority of listings on page 1 for search “xyz” have over 1,000 reviews, but one listing has only 130 reviews. Relative to the rest of the listings, 130 reviews is quite few.  

Based on what we have observed, the product with 130 reviews will struggle to sell at a similar volume compared to it’s competitors with ample social proof at 1,000+ reviews. Review quantity is a major determinant considering all else is approximately equal (price, review rating, etc.). There are certainly exceptions, but this seems to essentially be the rule. This has been observed nearly daily in our experience helping newer products achieve keyword ranking among more mature listings.

While there are certainly ways to supplement a high review quantity to drive a relatively high volume of sales with other forms of social proof (ex. Best Seller badge, Amazon’s Choice badge, superior aesthetics, etc.), reviews are generally the product market’s “economic moat”. Overcoming competitors’ economic moat (reviews), is a function of time multiplied by your review rate. The faster you are able to achieve reviews, the quicker you will be able to overcome that competitive moat. This translates to: as a product achieves a relatively similar review quantity to its competitors, organic sales volume will increase.

For this reason, we identify the market’s comparative review threshold to be the amount of “investment” necessary to reach a market’s sales potential.

ROI Ratio = Monthly Sales Potential ÷ Review Quantity

Example of high ROI Ratio: 1000 units/month / 100 reviews = ROI Ratio of 10!

Example of low/bad ROI Ratio: 1000 units/month / 1000 reviews = ROI Ratio of 1

We generally suggest looking for product markets where the average ratio is somewhere above 2-3, as these are typically some of the best products to sell on Amazon. Conversely, stay away from markets where that ratio is less than 1. The higher the ROI Ratio, the more likely it is a good market to get into (it is still important to analyze the rest of the market metrics).

An Example of Sales to Review Ratio (AKA the ROI Ratio)

Imagine the average top seller in a market was driving 1,000 sales per month with an average review quantity of 45. The sales to review ratio would be (1000 / 45 =) 22! That is incredible. Driving just 45 reviews is a very simple feat (depending on the product as some products naturally are harder to obtain reviews for). So the amount of investment, time and money spent achieving just 45 reviews, is very low considering the sales potential of ~1,000 sales per month. We would consider this a very favorable market to get into – a great product to sell on Amazon.

Conversely, here is an example of a product market where the ROI Ratio (sales/review ratio) is approximately 1 or less. The amount of investment (time and money) needed to obtain a competitive number of reviews (1,000) in order to reach the sales potential (~1,000 units/month) is far too high for our liking. There are obvious exceptions: maybe you have the money to bully your way to the top, perhaps you have a dramatically superior product (very RARELY is this a viable excuse), maybe you are okay with a low sales volume for this product as it’s a natural extension of your brand, among others.

The Psychology of Review Quantity

Here is a brief rundown of our assumptions into the customer psychology of this phenomenon. Review quantity stands as the most evident form of popularity to the consumer among the products shown in the search results (while Amazon provides BSR to provide an indicator of popularity, a simple survey of Amazon buyers will quickly reveal this is not a well known metric nor is it shown in the search results). Which product do you think has sold more units?

As consumers we want a “safe bet” when it comes to making a purchase. We want to be sure that whichever widget we purchase will completely satisfy our needs and will not break within an unreasonable time. Consumers also fall subject to the bandwagon effect in which they buy the item because it is “popular”, which in turn, increases its popularity. “Many others are purchasing/not purchasing this widget for a reason, so I will take the safe bet and follow suit.”

Download the Complete Guide

Did you enjoy discovering the key metric to identifying the best products to sell on Amazon? To get other golden nuggets on sourcing your next home run, download the Ultimate Guide to Sourcing Private Label Gold Mines.

Contents include:

  • Crucial concepts
  • Product data vs. market data
  • Interpreting and analyzing market data
  • The key metric to ROI
  • Plotting your course for success

And more…

Fill out the form below to receive the guide and start sourcing gold mines:

The ROI Metric: Identify the Best Products to Sell on Amazon

Related:

Generate Amazon Product Ideas: 3 Creative Methods for Sellers

Understanding the Amazon Best Sellers Rank (BSR) – The Definitive Guide

Your Amazon Sales Data Is Costing You Thousands

The foundation of a successful Amazon business is great Amazon sales data. How’s that, you ask? Well, in order to have a successful Amazon business you have to have great products. And in order to source great products, you need to be able to identify great market opportunities. You need accurate and comprehensive Amazon sales data. We have hundreds of sellers come to us each month asking for help with their business. And why are they struggling? Poor product selection. Many of them have gotten into insanely competitive markets and don’t have the budget to achieve success. Others sourced products where they were forced to lower their price and now sell with razor-thin margins.

Many of these sellers even used a market research tool to determine whether or not to source. So what went wrong? Their Amazon data wasn’t giving them an accurate picture of the market. Most software is grossly inaccurate, calculating estimates using a single snapshot of BSR data 

Where Other Amazon Product Research Tools Are Lacking

Snapshot Data

Most tools that use the Amazon Best Sellers Rank as their indicator for estimating sales are relying on the brief snapshot of what BSR is RIGHT NOW. Those tools are estimating sales over the last 30 days, based on a metric highly influenced by the last 24 hours. Using Snapshot data to analyze performance is like looking at a still frame of a movie and trying to predict the plot. It can be extremely inaccurate. As we discussed in our blog post covering the Amazon Best Sellers Rank, BSR can vary drastically hour to hour, day to day, month to month, etc.

Using a product’s BSR to estimate sales can make a market look awesome one hour and completely different 12 hours later.

  • Do you do your product research primarily on the weekends? Be careful. Consumer buying behavior in some product markets will affect BSR and those snapshot estimates over the weekend.
  • Do you do your market research primarily in the mornings? Again, be careful. Some markets see higher sales in the morning hours, meaning BSR will be lower. That means that tools with snapshot estimates will show higher sales volume than they would if you did your product research at night.

To accurately estimate sales, you need to take into account all the fluctuations of BSR that occur throughout the month.

Have you ever tried doing product research during November and wondered if the estimated sales numbers were inflated due to holiday sales or if those numbers were consistent throughout the year? Perhaps you have done research on some of the weight loss products during January and February when sales are much higher than they are throughout the rest of the year. There are tons of consumer buying trends you may not be intuitively aware of, so how do you know the likelihood of your estimated sales numbers remaining consistent across time? 

Not knowing how sales are trending across a market as a whole is dangerous when sourcing a product. To not have a complete picture of how sales trend throughout an entire calendar year for a product is kind of insane when you consider the amount of time and the thousands of dollars you spend getting initial inventory, creating a listing, and trying to gain traction.

ASIN Focused

Don’t look at just one ASIN. While some sellers may be well aware of this common fallacy, we’ve seen plenty who have unknowingly made this critical mistake. When doing research to determine which product markets you want to get into, you should be focused on the performance of the market as a whole, not a specific ASIN. Tracking how well a particular ASIN is performing in sales, keyword ranking, reviews, price, etc. is dangerous. There are so many potential external factors and reasons as to why sales are where they currently are.

Perhaps an ASIN with very few reviews but really high sales is only performing that well because the seller is a wizard at driving external traffic. Can you match that performance? There are plenty of reasons that sales may fluctuate per ASIN: running out of stock or driving external traffic. There are also plenty of reasons that price may fluctuate: split testing, temporarily attempting to push traffic. There are reasons that almost every metric you can track for a given ASIN may be fluctuating. But when you look at snapshot data, you don’t see the fluctuation, and you definitely don’t see what’s going on behind the scenes for that product. 

Research should not be a question of “how well is this specific ASIN performing?” but a question of “what is the sales potential in this market?” Ask yourself what the barrier to entry is for the market, and what the opportunity to outsell the competition is. Both of these questions require you to look at all of the top competitors and analyze the whole market.

Validation 

We work with the entire spectrum of sellers on Amazon. From large brand names to sellers trying to find their first item. For those in Facebook groups, I’m sure you’ve seen it a million times where someone posts a screenshot of the results from a sourcing tool where they ask “should I source this?” or “is this a good idea?” For every one of those posts, there are hundreds of sellers who don’t ask for help and end up getting into a product market where they waste precious resources: time and money.

At Viral Launch, we truly do believe that every product is a good product to sell so long as the numbers make sense for you. But there are some basic principles that make certain products absolutely great investments and others potentially risky. Think of it this way: if you’ve never been ice skating before, you’re probably not going to try competing against Olympic athletes the first time you lace up your skates. If you’re a new seller you don’t want to take on a highly competitive market like Vitamin C Serum. And even as an established seller, you might not want to take on a big brand like Tide in a market like Laundry Detergent. With the right knowledge, anyone can sell on Amazon. But that doesn’t mean anyone should sell in any market. And we believe your market research software should help you determine which markets are most favorable for you.

Product Suggestions

Imagine if you could snap your fingers and instantly know exactly which products you should source. That would be like every seller’s dream come true. And that’s why lists of hot products get so much attention. But a good product idea instantly becomes a bad product when it is easily accessible to many sellers. We have seen it plenty of times. Someone posts their list of hot new products, and within a couple of months, we have 20+ sellers come to us with those hot products. These product markets very quickly become saturated and the barrier to entry increases dramatically. Price wars cut margins in half, and suddenly that market that looked so good is terrible.

Unfortunately, for some sellers who have already placed inventory orders, by the time their product gets to FBA, the market has already turned sour. The way to avoid this nightmare scenario is to avoid products featured on these lists! We’ve seen it happen as a result of a product being mentioned by a guru or from popular webinars or demonstrations. The same can and does happen with programmatic product suggestions. That’s why Product Discovery offers warnings for popular results. Our goal is to help inspire new product ideas and then help you determine how great that idea is. Of course it would be incredible to have someone provide unlimited “secret” high potential product market suggestions. Unfortunately, it’s dangerous for the sellers who jump in.

Not Mobile Friendly

Our phones are a huge part of our lives these days. And we expect to be able to answer the questions that we have when we’re out to lunch or waiting for the subway. Market research software needs to be available in the same way that Google is available. It’s like your second brain. It’s right there when you need it. Because a product idea is going to hit you smack dab in the middle of your evening stroll around the neighborhood. Your best product ideas don’t always come when you’re sitting at your desktop. They probably come randomly, whether you’re out shopping, on your morning walk, in the bathroom, etc., having the opportunity to do a quick lookup on the go can be very helpful.

Stale Data 

Most software in this space does not update their information or algorithms regularly allowing estimates to become stagnate and remain that way for longer than 6 months. A BSR of #1 in Beauty back in 2015 is a lot different than a BSR of #1 in Beauty in 2017. As Amazon continues to increase in popularity and more consumers shop on Amazon, the amount of sales any particular BSR represents, continues to increase.

Market Intelligence: Our Version of an Amazon Market Research Tool

Not Snapshot Data, Comprehensive Data

Amazon’s Best Sellers Rank can be extremely volatile hour to hour, day to day, and week to week. So in our mission to develop the world’s most accurate sales estimation tool, we had to build a tool that was going to take into account the vast fluctuations in BSR that occur all month, and we’ve done just that.

Our Amazon Market Intelligence tool tracks and analyzes seasonal trends and displays aggregated sales across the market for up to two years. This allows any seller to identify how seasonal consumer behavior may be affecting current sales numbers as well as how future seasonal trends may have an impact on future sales.


Not ASIN Focused, Market Focused 

From our “outlier detection”, to our page of collective Market Trends (from sales to price to review quantity), to our Product Idea Score, we do our best to push users to focus on the principles of the market as a whole versus anticipating to replicate the results of a single ASIN.

Validation 

Our Market Intelligence’s “VL Analysis” page is dedicated to helping sellers validate or invalidate their product idea providing them with a 1 – 5 star rating based on a customer algorithm analyzing an impressive number of market indicators. We go a step further and provide sellers with key tips, warnings, and alerts of the market if they do decide to enter in. This allows sellers a comprehensive view of a market’s potential outcome for success.

Not Product Suggestions, Product Idea Inspiration 

While we are strongly against providing Amazon product/market ideas, we are very keen on providing inspiration or tactics of coming up with your own ideas! This is why we started our Sourcing Saturdays to help you develop your own ideas to then research with our Market Intelligence software.

Not Stale Data, Fresh Data Every Day

Our Market Intelligence tool continually updates our BSR to sales mapping algorithm each night. This allows our calculation to remain severely accurate and consistent with the natural trends of the market. Due to seasonal trends across Amazon, as well as Amazon increasing in popularity, estimation tools that do not refresh their algorithm regularly will find their estimations quickly become stale and continue to decrease in accuracy as time goes on.

The Most Sophisticated Amazon Product Research Tool

There are three major components to our Amazon product research and validation software.

Market Research – Top Sellers

The market research component of our sourcing tool provides a view very similar to what most are used to. Essentially we grab the top ranking products for a provided search term.

We provide data specific to each product such as brand, price, product title, estimated units sold over the last month (see why our sales estimation algorithm is more accurate than any other tool), review quantity, the sales to review ratio [[include link to another post]], net profit per unit, and estimated monthly net profit. If you click into any of the highlighted metrics you will be provided with historical data from the last 3-4 months. This is important for developing a better understanding of how products have been performing and what to expect if you happen to jump into the market.

Under the “Filtered View” tab, you will see essentially the same information with some rows of the table possibly highlighted in light pink. Highlighted rows depict market outliers. An outlier is a product we’ve determined to be statistically insignificant due to either their sales or reviews being far outside the market norm. The general rule of thumb is simply to ignore those listings.

The “Competitive View” allows you to see important metrics also shown in the “Standard View” as well as the opportunity to see the product’s full image set and title. The intention here is to allow you to quickly identify the types of products potential competitors are selling for the given search term as well as identify possible areas where you could provide better creatives to out compete.

Clicking into an image allows you to quickly flip through each product’s image set.

Market Trends

Making a sourcing decision based solely on the metrics of NOW can be incredibly dangerous. Our trends tool allows you to quickly identify how sales across the market have been trending over the last two years (provided data is available) as well as how the average price point and review quantity have trended. Has price been dropping significantly over the last 90 days? It may not be a great market to get into as margins look to be declining. Is the average review quantity growing at a relatively slow rate? May be an opportunity to come into the market with a better review funnel to outpace competitors and dominate the market.

For convenience we display how price has trended over the last 90 days in a simple percentage metric. We display the product’s best selling period throughout the calendar year. This can be a single month or a few months depending on consumer buying behavior. Finally we display, the rate of increase in reviews per month (ex. +10 reviews/month).

Viral Launch Analysis

The Viral Launch Analysis tab is our attempt at algorithmically helping sellers steer clear of money wasting products and into potential gold mines.

To kick off, we show our “Product Idea Score”, which is programmatically generated based on a large variety of factors and metrics both real time and historical. We’ve put all of our knowledge and experience running over 16,000 product launches, working with thousands of brands large and small, into this rating algorithm. A five-star product means that you’ve found a potential gold mine so long as you are comfortable with the provided numbers. A five-star rating means that the sales potential compared to relative barrier to entry is ideal, in addition to satisfying other market indicators we’ve identified contribute to successful products.

          At the bottom of the page you will find our “Tips, Warnings, and Alerts” section. Here we try to bring to your attention some of the opportunities, topics to be aware of, and potential success crippling aspects of the given product market. An example of a tip would be to consider bundling the product as it appears others in the market are doing it with a degree of success. An example of a warning would that the average price point seems to be declining in the market so be cognizant of the potential cannibalizing of profit margin. An example of an alert would be a scenario in which page one is dominated by known name brands that are consuming the majority of the market share.

Other Features

ADVANCED SEARCH 

We’ve included two opportunities to customize the results based on your specific situation. Do you have a minimum monthly units sold threshold? Plug in your sales minimum and we will take this into account when calculating your Product Idea Score. Have an idea as to what the landed cost may be per unit for the product you’re looking to source? Plug that into the advanced parameters and we will take that into account when calculating the net Amazon profit for each product shown.

The Search For Smarter Sourcing Decisions

We didn’t build our Amazon product research tool because we thought we could make money if we provided a marginal improvement on a tool similar to what others before us had created. We HAD to create this tool to help sellers avoid the potentially tens of thousands spent getting into product markets they have no business being in. We are now starting to manage more and more accounts as a company and we needed accurate market data. It’s impossible to make accurate future projections without knowing where the market has been. The old adage, “you have to know where you’ve been in order to know where you’re going” is incredibly relevant to jumping into a product market.

Start making better sourcing decisions when you sign up for the most sophisticated Amazon market research tool in the galaxy!

START RESEARCHING

We would love your feedback on how we can improve. What additional information, either historical or real-time, would help you make better sourcing decisions? What calculations or computations would help you to be more informed? We would love to hear your thoughts so we can all benefit!

Amazon Best Sellers Rank (BSR): Definitive Guide

At Viral Launch, we thrive on understanding and discovering the intricacies and science of the Amazon marketplace. Because the more we understand about Amazon the better equipped we are to map out the process of selling successfully for you. One of our targets was to reverse engineer the Amazon Best Sellers Rank (BSR) algorithm.

The intent was to build an incredibly robust Amazon sales estimation algorithm with unprecedented accuracy. While we have built a far more accurate BSR-to-sales mapping algorithm than what is currently available, reverse engineering the Amazon Best Sellers Rank algorithm requires a far greater amount of data and sophisticated machine learning tactics.

Here are our findings on BSR and the downfalls of using Amazon’s Best Sellers Rank as a tool to estimate sales. 

 What is Amazon’s Best Sellers Rank?

A product’s Best Sellers Rank can be found on the product’s detail page. As you can see, products are typically listed in multiple product categories. There is usually a top level category: in this example it is #71 in Beauty & Personal Care. And there is a subcategory: this product is the #1 best seller in the sub category, Serums.

Often you’ll find a product in multiple subcategories and, somewhat less frequently, in multiple top level categories. For sales estimation equations, it is the top level category that the algorithms pay attention to. If someone had enough data to map out the current 64,000+ subcategories, they might use those numbers. But at the moment, that seems unlikely.

How is the Amazon’s Best Sellers Rank (BSR) Calculated?

The “best selling” product in a category has a BSR of #1 in that category. The second “best selling” product in a category has a BSR of #2 in that category. Amazon calculates a product’s Best Sellers Rank or BSR by considering the number of orders for that product compared to other products in the same category within a given amount of time. 

We tried to figure out the time frame in which orders are taken into account using a few different machine learning algorithms. We wanted to know how much weight Amazon was placing on various timeframes. The most successful of these algorithms was Linear Regression. 

[PRO INSIGHT: We also tried Decision Forest Regression, Bayesian Linear Regression, and Boosted Decision Tree Regression algorithms] Generally, with this kind of dataset, we would expect to use Linear Regression to help us understand how Amazon weights sales each hour. For example, using Linear Regression, we can determine that sales today are more heavily weighted than sales a year ago when calculating BSR.

To briefly explain how Linear Regression helped us reverse engineer the BSR equation, let’s break it down. Linear Regression is an AI equation that finds the proper coefficients for an equation by sorting through massive amounts of data. The equation looks something like BSR = X(a)+ Y(b) + Z(c)….. and so and and so forth.

Variables a, b, and c are the numbers of orders for each period of time, and X, Y, and Z are the amounts each period of time is weighted. For example, sales over the last hour (a) are worth 40% of the BSR calculation (X) and sales two hours ago (b) are worth 20% of the BSR calculation (Y).

Unfortunately, this approach did not return the exact calculation we were looking for. But it did help us uncover some great insights. 

What We Discovered About BSR

Though BSR has been difficult to work with, through trial, error, and analysis of massive amounts of data, we definitely learned a lot! Some of these are not new discoveries, but for those unfamiliar here you go:

  • BSR updates for a product within 2-3 hours of a sale (we assume depending on when the payment clears relative to Amazon updating the market’s BSR).
  • The BSR calculation more heavily weights recent sales.
  • Historical sales still hold considerable weight in the calculation.
  • We’ve seen two products with near identical BSRs have different sales by a couple of hundred during the last month. (Ex. BSR #76,430 and #76,433 with monthly sales of 94 and 310 monthly sales respectively).
  • We’ve seen products with much lower BSRs with far fewer sales (Ex. BSR #720 at 366 sales over the last month.).
  • New items with no sales do not have an Amazon Best Sellers Rank.
  • When it comes to listing variations, some types of variations do not have their own BSR. Instead sales roll up to the parent ASIN. Other variation types do have their own Best Sellers Rank.
  • BSR is order dependent and unit independent. (e.g. 90 items in a single order has as much impact as an order for 1 unit).
  • BSR can swing by tens, even hundreds of thousands in the lower ranks with a single sale. Likewise, BSR can plummet just as fast (we’ve seen drops of 10,000 per hour until another sale occurs).
  • BSR is re-calculated every hour for every product. We’ve never seen two products with the same BSR in the same hour.. so you can’t just re-calculate the top X products each hour as some people suggest.

So as you can see, BSR can be both an indicator of how well a product has sold in the past and an indicator of how well it has sold over the last few hours. The problem is you can’t tell exactly which unless you have detailed BSR history. Becuase BSR fluctuates so drastically and frequently, it’s almost impossible to determine anything from a product’s BSR at a single given moment.

An Example of BSR Fluctuations

Let’s take Product A and Product B. Product A has been selling steadily at 40 units per day in the Patio, Lawn, and Garden department for the last 6 months and Product B has only ever had 1 sale which was 31 days ago.

Let’s say that Product B get’s their stuff together and starts really promoting their product. Let’s say it sells 120 units total over the last two days. We would expect Product B to have a very similar BSR to Product A even though Product B has only sold 120 units over the last 30 days and Product A has sold 1,200.

Pretty crazy huh?

Different Ranks But Same Sales

With there being millions of products per category it is very possible for two ASINs to have the same number of sales but have very different BSRs.

Let’s say that Product A  has had 197 sales and Product B has had 200 sales over the last 30 days and their BSR is sitting at 12,000 and 10,0000 respectively. 

Okay, now let’s say that Product A had three sales in the last three hours, while product B has had none. We would expect Product A to be ranking somewhere in the 8,000’s even though they have had the same number of sales over the last month. 

Timing Is Everything

Product A has only ever had 2 sales on Amazon, and they both occurred 18 months ago. The product is now sitting with a BSR in Patio, Lawn, & Garden of #2,000,000. Product B on the other hand has only had 1 sale, but that sale occurred 12 months ago. Because Product B had a sale more recently than Product A, we would expect its BSR to be something like #1,000,000.

Even though Product A has had more sales, those sales happened earlier and reached “the bottom” of the BSR calculation, while Product B didn’t hit “the bottom” of the BSR calculation until much later. As BSR updates each hour, products that don’t report a sale generally get pushed down the ranks (increasing in BSR), and products that have a sale rise above.

BSR Is Bad For Sales Estimation (But It’s The Best We Have)

In our journey of crafting the most accurate sales estimation algorithm, we brainstormed all possible indicators of sales on Amazon’s platform. One thought was estimating sales based on an assumed average review rate per market, which would look something like this: if an average of 25 reviews were added per product in a month, and we assume review rate is 1% of organic sales then we would assume there were 2,500 sales that month.

This is obviously not the proper approach. But in brainstorming, no idea is a bad idea. The most popular alternative is tracking inventory levels, which has some major weaknesses. This approach does not allow for situations in which sellers are driving sales from external sources as well as listings whose inventory levels are above 999 units, or listings where the Max Order Quantity is set.

You may be wondering why we were so turned off by the way existing tools use BSR. Essentially, we were opposed to using the Best Seller Rank because it is such a volatile metric. BSR is globally updated per hour meaning each product’s Best Sellers Rank is calculated and adjusted each hour.

Each time Amazon pushes a BSR update, a given product’s rank can fluctuate dramatically. For example, we watched a product’s Best Seller Rank jump from 98,000 to 38,000 in one hour due to one sale. Then in the next hour it fell back down to 76,000. This drastic fluctuation is happening across the marketplace all the time.

Moving forward, let’s call the Amazon best sellers rank that you find on Amazon a “snapshot” (because it is just a snapshot in time as BSR changes hourly).

Let’s walk through an example of how snapshot BSR is a poor metric for estimating sales volume. Imagine you are wanting to source a tea kettle. When are people most likely to remember that they need to purchase a new tea kettle? Probably, most people remember to purchase a new tea kettle in the morning when they have their morning tea/coffee before work. That means, that BSRs for tea kettles are likely going to be lower (showing higher sales estimates) in the morning than at night.

So, if you do your sourcing research in the mornings, you are going to estimate higher sales volume than if you do your research at night. The same can be true for times of the week. Let’s say for example’s sake that half of tea/coffee drinkers only drink tea/coffee on work days to get some extra pep in their step on the way to work. That would mean that BSR/sales figures are going to be different when looking over the weekends versus weekdays.

Essentially because there is no direct calculation and because Amazon Best Sellers Rank can fluctuate so drastically within the scope of a day, week, and/or month, the Amazon Best Seller Rank is a poor indicator of past sales.

How We Built Our Sales Estimation Algorithm With This Knowledge

We don’t feel comfortable sharing too many specifics, but here are a couple of key aspects that allow us to have an incredibly accurate estimation algorithm in our Amazon product research tool.

As you can see, the Amazon Best Sellers Rank can be extremely volatile hour to hour, day to day, and week to week. So in order to build a sales estimation tool with any degree of accuracy, we had to build a tool that was going to take into account the vast fluctuations in BSR that occur all month, and we’ve done just that.

Using a snapshot of BSR to estimate the number of sales over the last month is like trying to predict the plot of a movie based on a single still frame. It can be extremely inaccurate. One feature of our algorithm that I would like to highlight is that we continually update our BSR-to-sales mapping algorithm each night.

Nightly updates allows our calculation to remain consistent with the natural trends of the market. Due to seasonal trends across Amazon, as well as Amazon’s increasing popularity, estimation tools that do not refresh their algorithm regularly will find their estimations quickly becoming stale and continuing to decrease in accuracy as time goes on.

See just how accurate our sales estimates are with a free trial of Market Intelligence!

START YOUR FREE TRIAL

Exit mobile version