“Amazon Product Data: How to Interpret & Analyze” is an excerpt from Viral Launch’s Ultimate Guide to Sourcing Private Label Gold Mines ebook. Download the full ebook at the bottom of this post.
—
Interpreting and Analyzing Amazon Product Data
Sourcing tools provide A LOT of information! Having more data, assuming it is accurate and relevant, is always going to help sellers make better sourcing decisions as they research products on Amazon. However, that is assuming those sellers know how to interpret and leverage that information to inform their decisions. Here we will do our best to highlight all of the available data, what it means, and how it should influence your sourcing behavior.
Doing Amazon product research using Market Intelligence begins when you run a search for the product you have in mind. We highly recommend that you search the product’s most relevant yet basic term. For example, if you are searching for a vitamin c serum, don’t search “Vitamin C,” which is too broad, or “Vitamin C Serum for Women,” which is too specific. Simply search for “Vitamin C Serum.”
Identify what customers are purchasing for this search term
Knowing what is selling for a search term and/or product market is crucial. Imagine you wanted to sell some gloves to cover your hands while grilling, and you had a product like this in mind:

Well, when you search “grill gloves” or “grilling gloves”, you’ll find that more customers are actually looking for a five finger glove made of either silicone or another heat resistant material.
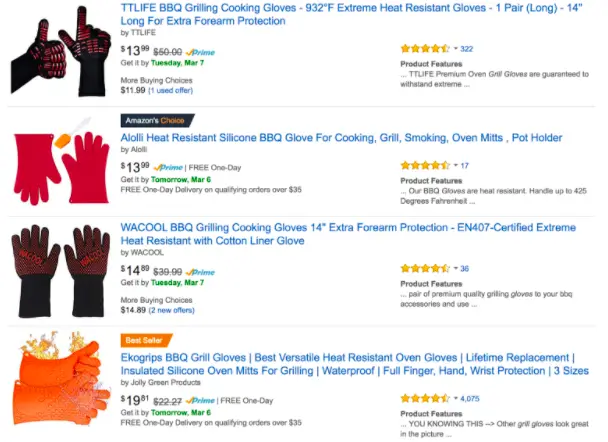
Sourcing the wrong type of widget for the search term you’re researching can have major implications. Sure, you can still sell the widget with different positioning that is more relevant to what is actually selling (in this case you would need to position your “grilling gloves” as oven mitts), but the market landscape for oven mitts may be completely different than for grill gloves.
You may have to sell at a completely different price point in a market that could be far more competitive. We’ve seen instances, much worse than this example, of sellers not knowing what is already selling when trying to enter a market. Most of the time, it ends with a much lower ROI than anticipated.
In conclusion, know the proper positioning of your widget, and sell a product that is very similar to what the market is already purchasing.
Identify Outliers
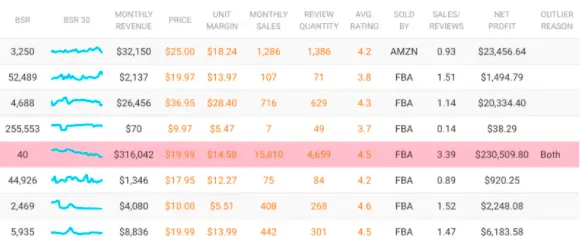
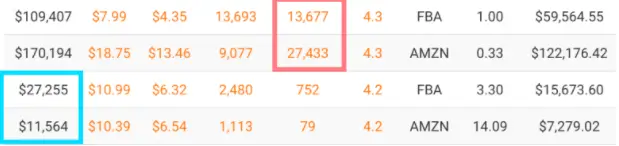
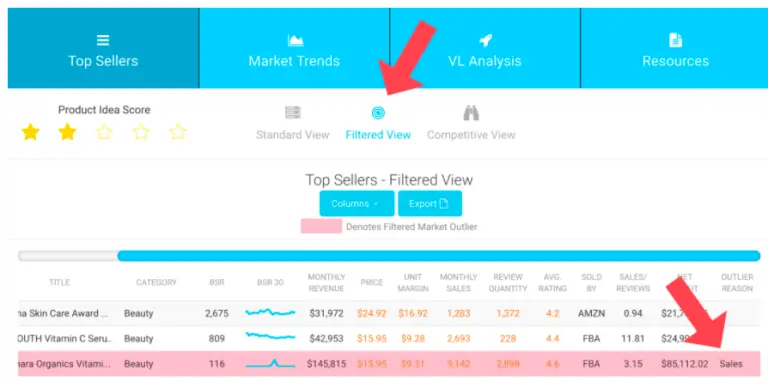
When it comes to analyzing a market, you may come across a listing that has abnormally high or low sales and/or reviews. Generally, in your market considerations, we suggest dismissing those listings as outliers. In our experience, these listings are not worth taking into account when performing your analysis as they are not representative of the market or what you should expect for your product. As you can see in the image above, the highlighted row has an astronomically high number of sales relative to those listings around it. Market Intelligence will automatically flag those outliers for you when you display Amazon product data in the Filtered View.
Product Category
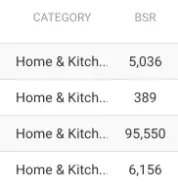
When it comes to Amazon product data, knowing the product category is crucial for estimating sales. Sales are estimated based on a product’s Best Seller Rank within its respective top-level category (ex. Home & Kitchen). Knowing the product’s category may also help you understand how other sellers are positioning the product. Finally, you’ll want to make sure that you know the requirements for certain categories and products requiring approval. Sourcing a product in a gated category without proper preparation will set you up for a headache down the road.
BSR (Amazon’s Best Sellers Rank)
What is it?
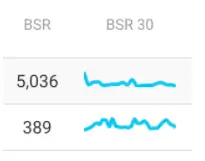
The Amazon Best Sellers Rank is a metric of a product’s sales relative to the rest of the market within a particular category. The top selling beauty product would have a BSR of 1. The second best seller would have a BSR of 2. This is very important for sourcing. Amazon product research tools use this metric to estimate a product’s sales by leveraging a proprietary algorithm that translates BSR to estimated sales. Market Intelligence shows a sparkline of BSR over the last 30 days to help give a quick view of how sales have trended for that product over the last 30 days.
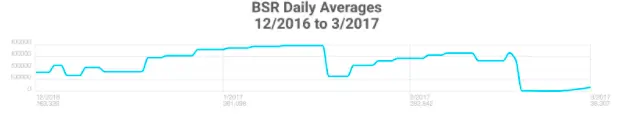
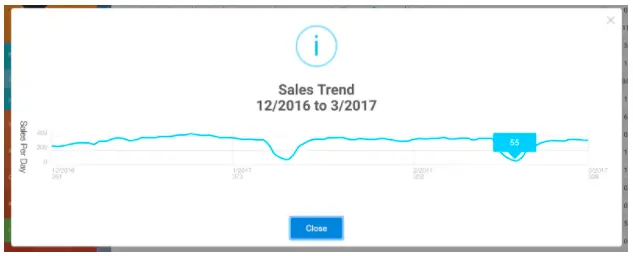
Clicking into the BSR 30 sparkline will present a popup that shows how the Best Seller Rank has trended over the last 3-4 months for the product.
Source Smarter
Looking at how BSR has trended for a particular product can help explain certain scenarios. For example, a sudden drop in BSR could indicate a promotional giveaway. In combination with the price trends, you may be able to explain fluctuations in BSR with fluctuations in price.
Monthly Revenue
What is it?
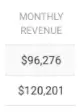
The purpose of this metric is pretty obvious. Monthly revenue is calculated simply by multiplying the monthly sales metric by the current price point. Knowing what other sellers are grossing in the market is important for knowing what the top line revenue potential is for the market.
Source Smarter
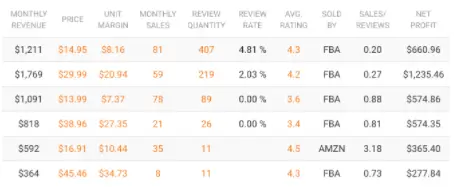
We strongly suggest not basing your expected sales on what the top 1 or 2 sellers in the market are selling. This suggestion goes back to not basing your expected results on any particular ASIN. We suggest taking an average monthly revenue from a few of the listings you feel confident you could compete with on ranking position, price, reviews, etc.
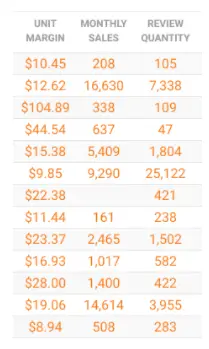
For example, I would expect to start-off selling around $10k/month in gross revenue based on this screenshot versus the $100k+ the top two sellers are selling at because they have very high review quantities.
Underestimating monthly revenue will do you much better than overestimating when calculating sales projections. It’s great to be optimistic, but this is an area where practicality will serve you well.
Price
Price is an important metric for informing your sourcing decision in two ways: 1) If you have a revenue/profit goal in mind, knowing how much you can charge per unit will help you know how many units you will need to sell each month. 2) Price will allow you to determine your product’s unit margin.
While some markets are more price sensitive than others, price can be a major lever in increasing/decreasing traffic, but can also have a major impact on profitability. We’ve seen so many sellers source “higher quality” products which forces them to charge much more than the average market price. There is certainly a time, place, and strategy for doing this. However, from our observations, this tends to end up being a mistake, and the product struggles to match projected sales volume.
Source Smarter
Make sure you can match the average market price with plenty of margin!
Unit Margin
What is it?
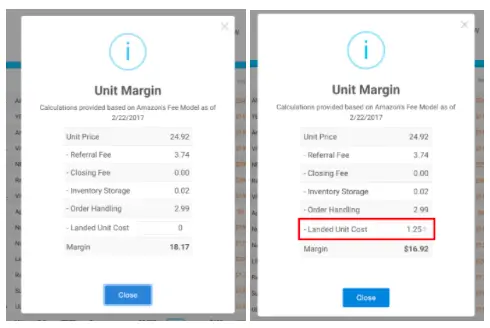
Unit Margin is the amount of money Amazon will pay out for each product purchased (considering no returns and promotions). The unit margin takes into account Amazon’s marketplace referral fee (Amazon’s fee for selling on their platform), the short term inventory storage fee (charged based on the product’s dimensions), Amazon FBA order handling fee (calculated based on the product’s weight and dimensions). You also have the option to input your landed unit cost to get an accurate representation of associated variable costs. The bottom line “Margin” figure offers a glimpse into what you can expect to be paid out by Amazon per unit. Tip: Changing the landed unit cost for one product will apply the landed unit cost to all products shown in the “Top Sellers View” for your convenience.
Source Smarter
Pay close attention to this field. For example, having the potential to drive top line revenue of $100k per month is fantastic, but let’s say the unit margin is close to $0, then that $100k top line figure is worthless as it won’t actually contribute to your bottom line. Another factor to be cognizant of is that the margin across markets can decline over time. If you find a market and product that allows you to have a comfortable margin, you will essentially have insurance for a profitable future.
Monthly Sales
What Is It?
Estimated monthly sales is an estimation of the number of orders a product has had over the last 30 days. Based on an enormous amount of aggregated market data, both historical and current, we’ve created a custom sales estimation algorithm that is updated and improved nightly. By observing a product’s Amazon Best Sellers Rank within a top level category, we are able to estimate the number of orders a product has seen. Part of our superior accuracy is our Composite Estimate. Looking at historical data, we provide estimated sales volume per day for the last three to four months.
Source Smarter
Knowing how other sellers in the market are performing is critical to identifying the sales potential. Sales volume is the largest indicator for success in a market. Products with high sales volume are performing well, those with low sales volume are not performing well. Estimated sales act as an indicator for many scenarios:
Product Type: By being able to observe how each individual ASIN is performing in estimated sales volume, allows you to identify which types of products are performing well. For example, looking at a Fish Oil, observing which pill counts have higher estimated sales will help inform you which pill counts you should consider sourcing and which you should avoid.
Sales Potential: Let’s say the top 10 sellers are driving less than 100 estimated sales per month, is this a market worth getting into? Yeah, maybe if each unit is selling at $100 per unit ($100 * 100 = $10,000), but if you can only charge $20 per unit with a top line revenue of only $2,000 it’s likely not worth getting into.
Inversely, let’s say that the top 20 sellers are averaging over 1,000 sales per month (excluding other factors). That means there is high potential and considering other factors, this could be a great product to get into so long as you can cashflow the inventory.
Review Quantity
What Is It?
Review quantity is one of the largest barriers to entry for a market. You must definitely pay attention to the review quantities of top performers. We’ve observed plenty of instances in which sellers enter a market due to high sales potential, but do not take into account the significance of the competition, and struggle to ever hit that sales potential.
Source Smarter
Pay close attention to how review quantity impacts sales.
Do all top sellers have a high relative review quantity? If so, this is an indicator that you will need a comparative number of reviews in order to sell at the same volume.
Are there plenty of ASINs with low relative review quantity that are selling at a high volume? If so, you may have the opportunity to sell at a decent volume with a low review quantity. This is generally a great thing, but you want to be careful to know this definitively.
Are there only one or two ASINs that are selling well with a low relative review quantity? A warning to the wise, we would identify those listings as outliers, and would suggest not taking their performance into account. If you want help identifying outliers, we suggest clicking on the “Filtered View” where we attempt to programmatically identify outliers for you.
Average Rating
What Is It?
This metric displays the average review rating for a product.
Source Smarter
While it is important to source a high quality product, knowing how other products are performing is an opportunity to know how your product needs to perform in order to stay competitive. For example, finding a product market with a low average review quantity (ex. Market average of 3.5 stars) could be an opportunity to source a higher quality product that customers are going to be satisfied with.
The savvy sellers will be sure to click in and read the reviews of many products in the market to learn what customers do/don’t like about current offerings as well as potential deficits and opportunities to provide a better experience. With that said, be mindful that your product updates/alterations do not cost too much on a per unit basis so as to drastically diminish your unit margins.
Who Owns the Buy Box

What Is It?
Here we denote what fulfillment method is being used, or identify if the product is shipped and sold by Amazon.
Source Smarter?
At the time of writing this piece, we feel that this metric should not have much of an impact in sourcing decisions. There are benefits to knowing what the competition is doing, for example, if many listings are fulfilling via FBM, are not Prime eligible, and economically it makes sense for you to fulfill via FBA, this may be an opportunity as shoppers and keyword ranking favor Prime eligible listings. There are also some concerns with trying to enter markets that are dominated by products sold by Amazon directly. These ASINs typically perform well and can be a bit more difficult to compete with.
Sales to Reviews Ratio
What Is It?
This is a simple ratio calculation of estimated monthly sales divided by current review quantity. We call this the “ROI Ratio”. We explain the importance of this metric later in extensive detail.
Net Profit
What Is It?
The Net Profit is an estimation of the payout the product produced over the last 30 days based on the calculation of estimated sales multiplied by the unit margin. (ex. $5.50 per unit *100 units sold = $550)
Related:
The ROI Metric: Identify the Best Products to Sell on Amazon
Generate Amazon Product Ideas: 3 Creative Methods for Sellers